Vertiv (VRT) Stock
Key stats
- Market cap
- $68.05B
- Price / Earnings ratio
- 37.7x
- EPS (TTM)
- $5.46
- Volume
- Loading
- 52-week high
- $379.94
- 52-week low
- $147.82
- Dividend yield
- 0.14%
- Dividend amount (latest)
- $0.06
- EPS vs analyst estimate
- +24.0%Q3 FY25 · $1.24 vs $1.00
Source: third-party data provider, as of November 7, 2026
EPS estimate: analyst consensus
Compare with VRT
Recent news
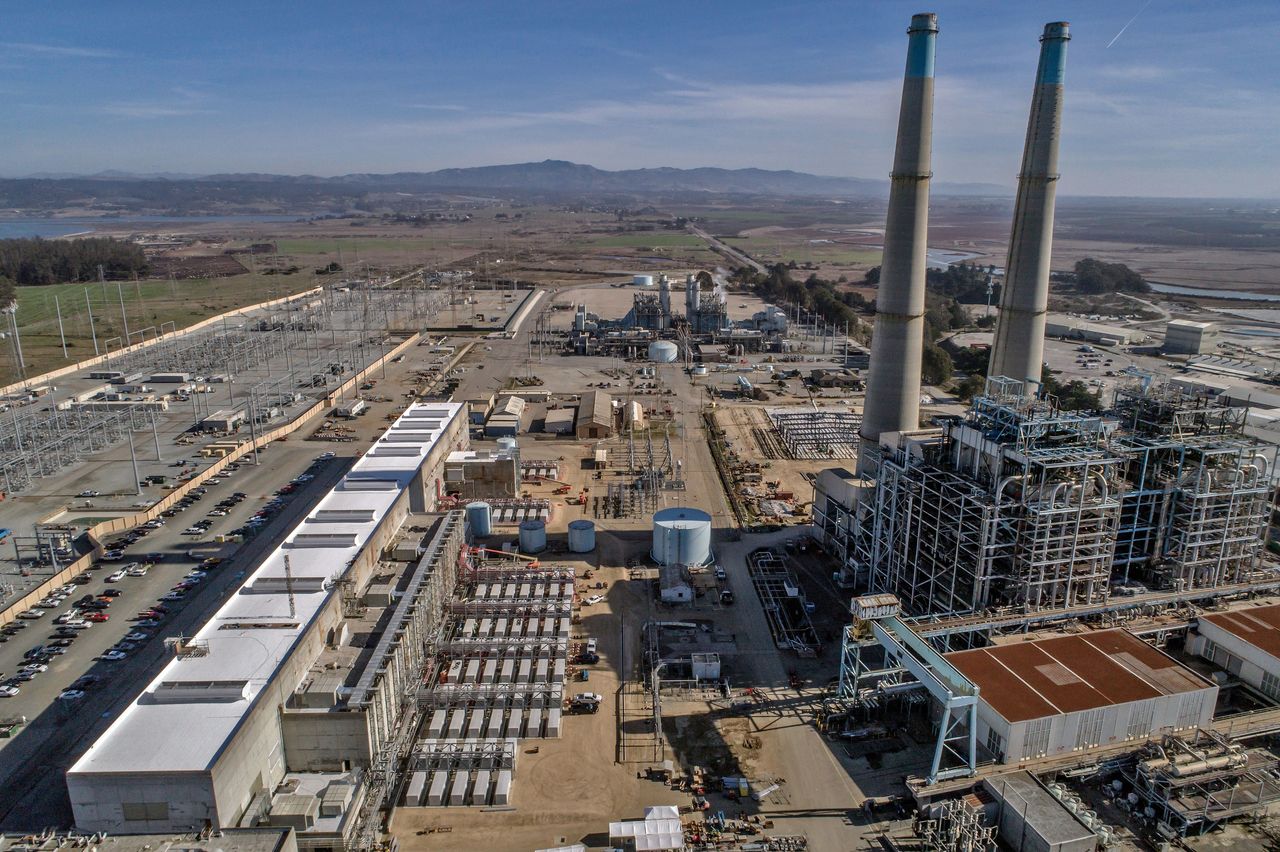
VST, CEG Stocks Drop As Election Outcome Hits Merchant Power Generators
VST, CEG Stocks Drop As Election Outcome Hits Merchant Power Generators
VRT
Microsoft and Oracle Can't Cool AI Data Centers Without This Growth Stock. Here's Why It Could Soar.
Microsoft and Oracle Can't Cool AI Data Centers Without This Growth Stock. Here's Why It Could Soar.
VRT
GE Vernova Rallies 7% as Bernstein Calls Election-Day Data Center Fears Overblown; Eaton Climbs 6%, Vertiv Gains 5%
GE Vernova Rallies 7% as Bernstein Calls Election-Day Data Center Fears Overblown; Eaton Climbs 6%, Vertiv Gains 5%
VRT
Vertiv Holdings Co. (VRT) Is a Trending Stock: Facts to Know Before Betting on It
Vertiv Holdings Co. (VRT) Is a Trending Stock: Facts to Know Before Betting on It
VRTNews tone: automated (AI) classification of the article's content, not a price prediction.
Technical indicators
- RSI 14
- 34.08
- MACD 12/26/9
- -8.42
- EMA 9 of MACD
- -7.61
- MACD histogram
- -0.81
- SMA 50
- $238.73
- Price below SMA 50
- EMA 50
- $236.48
- Price below EMA 50
- SMA 200
- $271.21
- Price below SMA 200
- EMA 200
- $246.97
- Price below EMA 200
Calculated by Gotrade from daily closing prices, as of November 5, 2026. Technical data, not a recommendation.
Analyst ratings
Analyst consensus: Buy
Based on 9 analyst ratings
Third-party analyst opinion, not a recommendation from Gotrade.
Financials
Performance
Debt & Balance Sheet
Revenue to Profit
2025Earnings
The market is expecting earnings per share of $1.46 for this quarter. The company has not yet shared when it is announcing earnings.
Source: third-party data provider
Latest news
VST, CEG Stocks Drop As Election Outcome Hits Merchant Power Generators
VST, CEG Stocks Drop As Election Outcome Hits Merchant Power Generators
VRTMicrosoft and Oracle Can't Cool AI Data Centers Without This Growth Stock. Here's Why It Could Soar.
Microsoft and Oracle Can't Cool AI Data Centers Without This Growth Stock. Here's Why It Could Soar.
VRTGE Vernova Rallies 7% as Bernstein Calls Election-Day Data Center Fears Overblown; Eaton Climbs 6%, Vertiv Gains 5%
GE Vernova Rallies 7% as Bernstein Calls Election-Day Data Center Fears Overblown; Eaton Climbs 6%, Vertiv Gains 5%
VRTVertiv Holdings Co. (VRT) Is a Trending Stock: Facts to Know Before Betting on It
Vertiv Holdings Co. (VRT) Is a Trending Stock: Facts to Know Before Betting on It
VRT
Vertiv Shed 30% Over 6 Months: This Analyst Says 75% Gains to Come With Others Arguing Similarly
Vertiv Shed 30% Over 6 Months: This Analyst Says 75% Gains to Come With Others Arguing Similarly
VRT
Should You Buy, Sell, or Hold Vertiv Stock Post Q3 Earnings?
Should You Buy, Sell, or Hold Vertiv Stock Post Q3 Earnings?
VRT
3 AI Power Stocks to Hold for the Next 10 Years
3 AI Power Stocks to Hold for the Next 10 Years
VRT
Unlocking Vertiv (VRT) International Revenues: Trends, Surprises, and Prospects
Unlocking Vertiv (VRT) International Revenues: Trends, Surprises, and Prospects
VRT
Buy Vertiv on Solid Q3 Earnings Guidance to Tap Huge Price Upside
Buy Vertiv on Solid Q3 Earnings Guidance to Tap Huge Price Upside
VRT
I Love Vertiv for 1 Reason, and It's Not the Backlog
I Love Vertiv for 1 Reason, and It's Not the Backlog
VRTNews tone: automated (AI) classification of the article's content, not a price prediction.
About Vertiv
Vertiv brings together hardware, software, analytics and ongoing services to enable continuous and optimal running of vital applications for data centers, communication networks, and commercial and industrial facilities in the Americas, the Asia Pacific, Europe, the Middle East, and Africa. The company serves social media, financial services, healthcare, transportation, retail, education, and government industries through a network of direct sales professionals, independent sales representatives, channel partners, and original equipment manufacturers. Vertiv Holdings Co is headquartered in Westerville, Ohio.
Key Executives
| Name | Title | Year Born |
|---|---|---|
| Mr. Giordano Albertazzi | CEO & Director | 1967 |
| Mr. David M. Cote J.D. | Executive Chairman of the Board | 1953 |
| Mr. Craig Chamberlin | Executive VP & CFO | 1980 |
| Mr. Scott Armul | Chief Product & Technology Officer | 1983 |
| Ms. Stephanie L. Gill Esq. | Chief Legal Officer & Corporate Secretary | 1972 |
| Mr. David J. Fallon CPA | Consultant | 1969 |
| Mr. Anand Sanghi | President of Americas | 1972 |
| Mr. Eric M. Johnson | Chief Accounting Officer & Corporate Controller | 1977 |
| Mr. Michael Giresi | Global Chief Information Officer | 1965 |
| Ms. Lynne M. Maxeiner | Vice President of Global Treasury & Investor Relations | — |
Fundamentals
Valuation
Profitability
Trading
Dividend
Source: third-party data provider, as of November 7, 2026
Technical indicators
- RSI 14
- 34.08
- MACD 12/26/9
- -8.42
- EMA 9 of MACD
- -7.61
- MACD histogram
- -0.81
- SMA 50
- $238.73
- Price below SMA 50
- EMA 50
- $236.48
- Price below EMA 50
- SMA 200
- $271.21
- Price below SMA 200
- EMA 200
- $246.97
- Price below EMA 200
Calculated by Gotrade from daily closing prices, as of November 5, 2026. Technical data, not a recommendation.
Analyst views
9 analyst ratings
Third-party analyst opinion, not a recommendation from Gotrade.
- Low
- $187.00
- Average
- $323.56
- High
- $376.00
Seasonality
Monthly price change (%)| Jan | Feb | Mar | Apr | May | Jun | Jul | Aug | Sep | Oct | Nov | Dec | |
|---|---|---|---|---|---|---|---|---|---|---|---|---|
| 2021 | -6.9 | +1.1 | ||||||||||
| 2022 | -14.4 | -38.3 | +11.2 | -14.1 | -12.8 | -20.5 | +37.8 | +0.7 | -15.4 | +27.2 | -6.7 | -3.8 |
| 2023 | +6.9 | +10.5 | -11.3 | +6.8 | +30.2 | +27.7 | +4.6 | +48.5 | -6.7 | +2.2 | +8.5 | +6.4 |
| 2024 | +23.4 | +13.7 | +15.7 | +15.7 | +10.8 | -9.9 | -9.2 | +12.2 | +32.3 | +12.0 | +19.4 | -10.6 |
| 2025 | -1.1 | -15.5 | -15.5 | +13.4 | +16.6 | +17.6 | +18.8 | -9.9 | +21.7 | +19.4 | -6.1 | -9.6 |
| 2026 | +6.0 | +34.1 | -2.8 | +26.6 | -3.8 | +3.5 | -22.4 | -1.6 | -5.7 | -5.5 | -8.3 |
Corporate actions
Upcoming
No upcoming corporate actions for VRT