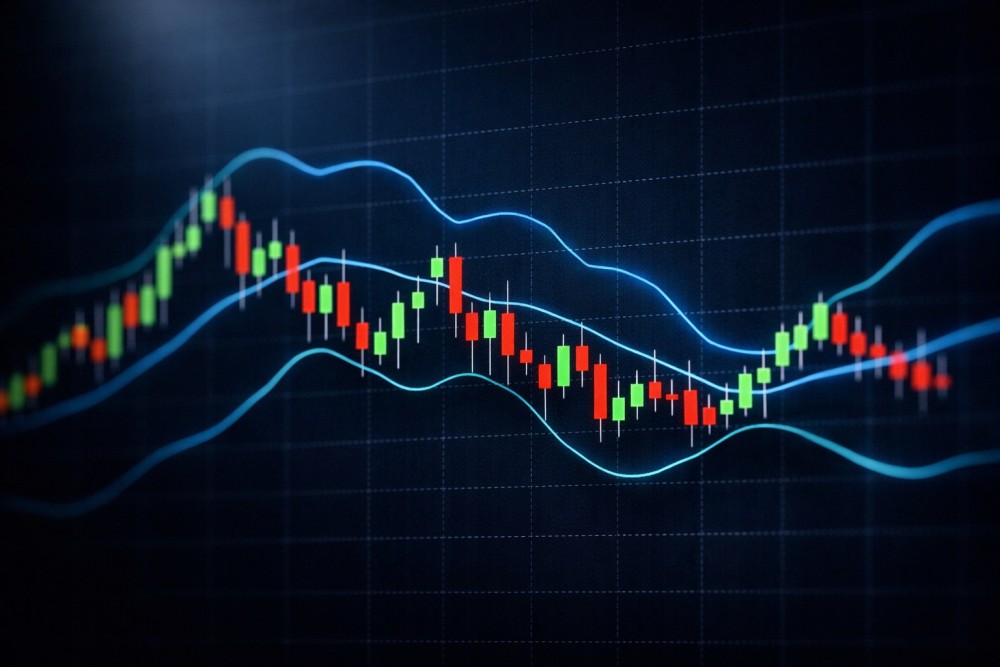
Bollinger Bands are one of the most widely used volatility tools on US stock charts. They wrap a moving average in two outer bands that expand and contract with price action.
For US retail investors, the appeal is simple. The same three lines can flag a quiet setup before a breakout, confirm a strong trend, or warn that a reversion trade is fighting momentum.
This guide covers entry and exit timing on names like Apple (AAPL) and Tesla (TSLA).
Bollinger Bands 101: Standard Deviation and the 20-Period Default
Bollinger Bands plot three lines around price. The middle line is a 20-period simple moving average, and the outer bands sit two standard deviations above and below it.
According to John Bollinger's official site, the 20-period, two-standard-deviation default captures roughly 95% of price action on a normal distribution. Excursions outside the bands are statistically meaningful.
When daily ranges expand, the bands widen automatically. When ranges compress, the bands pinch.
That self-adjusting behavior is why traders prefer Bollinger Bands over fixed-width channels. The indicator reads the current volatility regime, not yesterday's range.
The Squeeze: Identifying Low-Volatility Setups Before Breakouts
A squeeze happens when the upper and lower bands contract to their tightest reading in months. It signals that volatility has compressed and a directional move is statistically more likely.
The squeeze itself is not directional. It tells you a move is coming, not which way.
To trade it, mark the squeeze on your chart and wait for price to close decisively outside one of the bands. Strong volume on that breakout candle adds confidence.
Stops typically go just inside the opposite band. If the breakout fails and price closes back inside within one or two sessions, the setup is invalidated.
Walking the Bands: Recognizing Strong Trends vs Reversals
"Walking the bands" describes price hugging the upper band candle after candle in a strong uptrend, or the lower band in a downtrend. It is the classic sign of trend strength, not exhaustion.
Beginners often misread this. A tag of the upper band in a trending stock is not a sell signal by itself.
The reversal read is different. Look for price to push outside the band and then close back inside on the next session, ideally with a momentum divergence.
That close-back-inside is the reversion trigger. Without it, you are short-selling a freight train.
Case Study: Bollinger Signals on Apple (AAPL) and Tesla (TSLA)
Apple (AAPL) signal walkthrough
AAPL is a classic walk-the-bands stock during earnings-driven rallies. Price tags the upper band, pulls back to the 20-day middle line, then resumes trend.
Entry works best on pullbacks to the middle band during a confirmed uptrend. Exit when price closes below the middle line for two consecutive sessions.
Tesla (TSLA) signal walkthrough
TSLA behaves differently because of its higher beta. Squeezes on TSLA tend to resolve with explosive moves of 10% or more within a week.
Wait for the squeeze, then enter on the first close outside either band with above-average volume. Use tighter stops because TSLA reversals are equally violent.
Combining With RSI and Volume for Confirmation
Bollinger Bands work best as part of a system. John Bollinger himself recommends pairing them with two or three non-correlated indicators.
The most common pairing is RSI. When price tags the upper band and RSI prints a bearish divergence, the reversion read becomes credible. See our Relative Strength Index (RSI) guide for the exact divergence pattern.
Volume is the second filter. According to Fidelity's Bollinger Bands reference, breakouts that lack volume support tend to fade back inside the bands within a few sessions.
Ready to apply this? Review your watchlist with a Bollinger overlay and check which holdings sit in a squeeze right now. Open your Gotrade chart tools and start scanning.
Common Mistakes: Trading Reversion in Trending Stocks
The most expensive mistake is shorting the upper band touch in a trending stock like Nvidia (NVDA) during a strong uptrend. Walking the bands can persist for weeks, and reversion shorts get stopped out repeatedly.
Confirm regime first. If the 20-day middle line is sloping up sharply and price has stayed in the upper half of the bands for 10+ sessions, mean-reversion shorts are the wrong trade.
Another error is using default settings on every timeframe. Intraday charts need shorter periods, weekly charts respond to wider standard deviations.
Treat band touches as alerts, not signals. The signal is what price does after the touch.
Conclusion
Bollinger Bands give US stock traders a single tool for reading volatility, identifying setups, and timing entries. Pair the bands with RSI and volume, and respect the trend before fading any band touch.
Most losing Bollinger trades come from ignoring regime, not from bad signals. Check your portfolio's volatility setup this week. Open your Gotrade chart tools and scan your active positions.
FAQ
What is the best Bollinger Bands setting for US stocks?
The 20-period SMA with 2 standard deviations is the default and works well for daily charts on US large caps.
Can Bollinger Bands predict the direction of a breakout?
No, the squeeze signals that a move is coming but not which direction, so wait for a confirmed close outside the bands before entering.
Are Bollinger Bands reliable on volatile stocks like TSLA?
Yes, but use tighter stops because high-beta names produce stronger breakouts and faster reversals.
Should I use Bollinger Bands alone for trade entries?
No, John Bollinger himself recommends combining the bands with two or three non-correlated indicators like RSI and volume.
What does it mean when price walks the upper band?
Price hugging the upper band signals a strong uptrend in progress, not an overbought reversal, so reversion shorts in this regime usually fail.