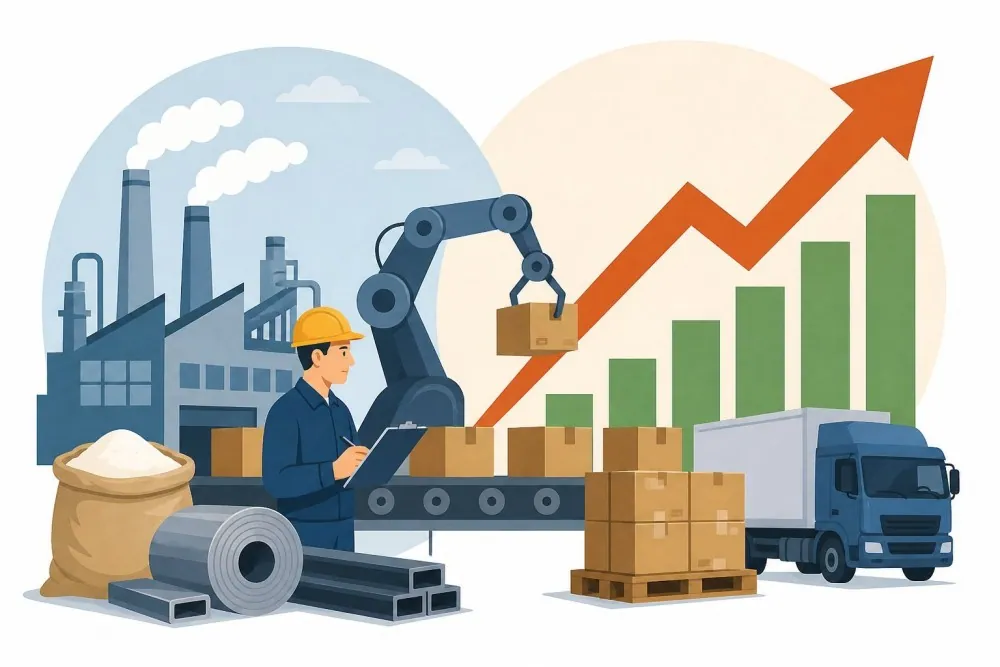
PPI stands for Producer Price Index, specifically in PPI is a monthly measure of the prices that domestic producers receive for their goods and services. PPI is an indicator of inflation, since it measure price changes month over month. In the US, this index is published by the U.S. Bureau of Labor Statistics (BLS)
Data used in this article was updated as of 20 October 2026. This article is for education, not financial advice.
What Does PPI Stand For?
In economics, PPI stands for Producer Price Index. Unrelatedly, PPI can also mean pixels per inch, proton pump inhibitor, or payment protection insurance, which we are not going to discuss in this article:
Field | PPI | Description |
|---|
Economics | Producer Price Index | Changes of prices producers get for what they sell |
Tech | Pixels per inch | How many pixels fit in one inch of screen |
Medicine | Proton pump inhibitor | A type of drug that lowers stomach acid |
Insurance | Payment protection insurance | Insurance cover that pays your loan or credit card repayments |
What Is the Producer Price Index?
The Producer Price Index is an index which measures price changes, from the seller's side, in the market. This number gives a picture on the rate of inflation, at wholesale level and not the end consumer level. The index follows thousands of prices, reported (voluntarily) by thousands of companies which are domestic producers. Remember that this index does not track what people are paying on the counter at grocery stores. There is a separate measure for that, called the Consumer Price Index or CPI (we will discuss it later in this article).
In the United States, the U.S. Bureau of Labor Statistics (BLS) publishes PPI every month. According to BLS itself, they release about 10,000 indexes a month, built from more than 16,000 establishments that give about 64,000 price quotes. Most countries in the world track their PPI, and the data can be accessed via IMF.
PPI Outside the US
Many countries publish their own producer price measure. In the UK, the Office for National Statistics (ONS) publishes producer price inflation every month, tracking the prices of materials and fuels that UK manufacturers buy (input prices) and the factory-gate prices they charge (output prices). It is published every quarter. Other agencies from other countries define their measures differently, although IMF and OECD do provide methodologies to be followed.
Which PPI Number Is in the News?
There are several types of PPI numbers. Most news use "final demand", since it is the one most related to personal consumption. BLS also publishes several other PPI numbers, and each one has a different purpose.
PPI Type | Purpose | Where |
|---|
Final demand | Covers goods, services and construction sold for personal consumption, business, government purchases and exports | News headlines |
Core | Final demand without food, energy and trade services | Trend analysis |
Intermediate demand | Goods, services and construction sold to businesses | Supply chain analysis |
All commodities | An older index of goods prices, with no services | In long-run charts (e.g. FRED) |
Besides those numbers, the PPI can also be presented monthly, yearly, with or without adjustments.
Month over month compares this month with last month. It shows the latest move. Year over year (also "12 months") compares this month with the same month a year ago. It smooths out one-off jumps.
Seasonally adjusted PPI removes patterns that repeat every year, so a normal seasonal swing is not misunderstood. In its monthly news release, as for BLS, they give its seasonally adjusted numbers for monthly reports, while and 12-month reports are not adjusted.
How PPI Is Calculated
Monthly PPI changes are calculated using this simple formula:
Percent change = (Current index − Previous index) ÷ Previous index × 100
Example: If an index moves from 200 to 204, then the change is 4 points. Since 4 ÷ 200 = 0.02, his means the index rose by +2%. The news usually reports PPI in percentage of changes, and not the absolute numbers.
PPI vs CPI
In short, PPI shows the changes in what sellers receive, while CPI shows what consumers pay. The two index rarely match since there are sales taxes, distribution costs, and other expenses that occur before consumers receive the goods. Here are the differences:
| PPI | CPI |
|---|
Point of view | Seller | Individual buyer |
Included | Goods and services sold to other businesses as inputs, exports, business investment, government purchases, and medical care paid by third parties such as insurers | Imports, housing rent, and sales and excise taxes |
Excluded | Imports, housing rent, and sales and excise taxes | Business inputs, exports, business investment, government purchases, and medical care paid by third parties |
| | |
Why PPI Matters, and What It Cannot Tell You
BLS lists many uses for PPI. Three of the most common:
A gauge of price pressure at the producer level. PPI captures price moves before the retail stage, so it may hint at later price changes for businesses and shoppers.
Contract price adjustment. Buyers and sellers often tie contract prices to PPI. BLS's own example is a long-term bread contract, where the bread price is adjusted by the percent change in the PPI for wheat.
A deflator for other data. Economists use PPI to strip price changes out of other numbers. For example, constant-dollar GDP is estimated with PPI-based deflators.
PPI also has limits:
Pass-through is imperfect. A rise in producer prices does not always reach shoppers in full or on time. Sellers may absorb some of it, and CPI includes things PPI does not, such as housing rent and imports.
One month is one month. A single reading can be driven by a few items. In September 2026, for example, final demand energy prices jumped 10.8%, and BLS traced over 80% of that month's rise in goods prices to energy. BLS also revises recent months as late reports and corrections come in.
The Latest PPI Report and Next Release Date
The latest report covers September 2026, and BLS published it on 15 October 2026. All figures below come from the BLS news release and were checked on 20 October 2026.
Item | Reading |
|---|
Reference month | September 2026 |
Released | Thursday, 15 October 2026, 8:30 a.m. ET |
Final demand, month over month (seasonally adjusted) | +1.3% |
Core (final demand less foods, energy and trade services), month over month (seasonally adjusted) | +0.5% |
Final demand, 12 months to September (not adjusted) | +6.3% |
Core, 12 months to September (not adjusted) | +5.0% |
Next release | Friday, 13 November 2026, 8:30 a.m. ET, for October 2026 |
BLS says the 1.3% rise was the largest monthly advance since March 2022, when final demand rose 1.7%. The 6.3% rise over 12 months was the largest since December 2022, when it was 6.4%. BLS can revise each month's figures for up to four months after it first publishes them.
How to Read a PPI Report in Four Steps
Here is the September 2026 report, read one step at a time. The same four steps work on any release.
Check the reference month and the release date. A release usually covers the month before it comes out. The report published on 15 October 2026 covers September.
Start with the headline. That is final demand, month over month, seasonally adjusted. In September it rose 1.3%.
Compare it with core and with the 12-month change. Core rose 0.5% in September, well below the headline 1.3%, so food, energy or trade margins explain much of that month's move. Over 12 months, final demand was up 6.3% and core was up 5.0%.
Read what drove the move, and expect revisions. In September, goods prices rose 2.6% and services prices rose 0.8%. Energy jumped 10.8%, and BLS traced over 80% of the rise in goods to it. On the services side, BLS put nearly half of the increase down to a 1.4% rise in trade services margins. The same release revised May to August, so a number you read last month can change.
FAQ
What does PPI stand for?
PPI stands for Producer Price Index.
What are the other meanings of PPI?
Pixels per inch, proton pump inhibitor, payment protection insurance.
What is the Producer Price Index, and what does it measure?
PPI is a family of indexes that measures the average change over time in the selling prices domestic producers receive for their goods and services.
Who publishes it, and how often?
The U.S. Bureau of Labor Statistics publishes it every month, usually during the second full week of the month after the one it covers. Other countries usually also publish their own.
How is PPI calculated?
It collects selling prices through survey and shipment data. The news then reports the percent change: (current index − previous index) ÷ previous index × 100.
Which PPI number do news stories quote?
Usually, they report the final demand.
What is the difference between PPI and CPI?
PPI tracks the sale prices that sellers receive. CPI tracks the prices that consumers pay.
What does a rising or falling PPI mean?
A rising PPI means the prices producers receive went up on average, a sign of more price pressure at the producer level. A falling PPI means those prices went down on average.
Does PPI predict consumer inflation?
PPI can give an early hint. Treat PPI as one early signal, not a forecast of CPI.
When is the next PPI report released?
See the BLS release schedule.
How is PPI used in contracts?
PPI data are commonly used to adjust purchase and sales contracts.
Do other countries have a PPI?
Yes. In the UK, for example, the Office for National Statistics (ONS) publishes producer price inflation every month. Each agency defines its measure differently, so check the definitions before you compare numbers across countries.