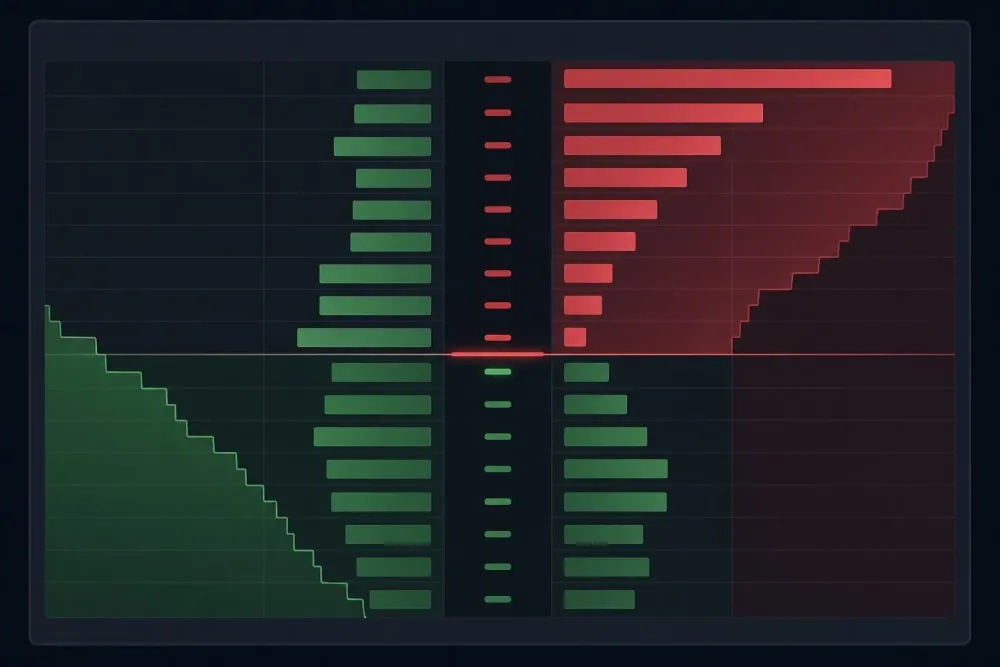
Order book at the stock market is a list that tells you what you can buy or sell right now, and how many shares are available at that price.
This article discuss how order book works, how to read order book, how orders get matched, and why your fill price can differ from the price on your screen.
Order book at the stock market is a list that tells you what you can buy or sell right now, and how many shares are available at that price. The order book can also give a picture on how far a bigger order could push the price. In this guide, we will discuss how to read order book, how orders get matched, and why your fill price can differ from the price on your screen.
This article is for educational purpose only, not a financial advice or recommendation.
What is an Order Book?
An order book is a live list of the buy and sell orders, waiting to trade a stock. The buyers and sellers can remain anonymous, but sometimes they can also be identified. The list shows the price and the number of shares at each price. Buyers' orders (called 'bids') sit on one side and sellers' orders (called 'asks') on the other. A trade happens when a bid and an ask meet at the same price.
The order book gives transparency for market participants, and provides important informations. It pictures the market depth, or how much order the market can absorb for a particular stock. It also gives you a sense on how liquid a stock is, meaning how fast or slow you will be able to buy and sell the stock.
How Order Book Works
Here is an illustration of how an order book may look like. The numbers are fictional and the table is simplified, so when you see order books on platforms like stock broker apps, the interface might be more complicated. But the basic principles stay the same.
Side
Price
Shares
Ask
$50.05
600
Ask
$50.04
400
Ask
$50.03
300
Best ask
$50.02
200
Best bid
$50.01
300
Bid
$50.00
500
Bid
$49.99
700
Bid
$49.98
400
Bid
$49.97
800
Best bid means the highest price any buyer will pay right now ($50.01, for 300 shares).
Best ask is the lowest price any seller will accept right now ($50.02, for 200 shares).
Spread is the gap between best bid and best ask ($0.01).
If you want to buy shares immediately, you will pay the ask, and if you want to sell immediately, you will receive the bid. This does not include fees your broker may charge per transaction, so when trading in real life, please keep it in mind and check with your broker for details.
There are two types of basic order here: limit orders, which sit in the order book, and market orders.
Limit orders: this is when buyers and sellers name a price. If they don't match right away, the orders will rest in the book and add liquidity (shares availability for others).
Market orders: when buyers and sellers ask to trade immediately at the best available prices. They take liquidity and remove resting orders from the book.
There are also "market makers", those who post both a bid and an ask at the same time, hoping to earn the spread. In our previous example, every row is a limit order which has not matched. A market buy would eat up the "asks", and a market sell would eat the "bids". The best price will fill first, and if there are multiple orders at the same price, the earliest is prioritized. A better-priced order always jumps the line.
How to read an order book
Using the same example above, there are multiple things we can learn from that order book. These information might be the most basic (and useful) for traders in evaluating a stock.
Best bid and ask: Here, it is $50.01 and $50.02.
Spread: $0.01 (about 0.02% of the midpoint). It is roughly what you give up if you buy at the ask or immediately sell at the bid.
Depth: The best ask has only 200 shares, so a bigger buy will move up to the next price quickly.
Demand vs Supply: The top three bid levels hold 1,500 shares and the top three ask levels hold 900, so there is more buying interest waiting than selling.
People also use the terms Level 1 vs Level 2. Level 1 data means it shows only the best bid, best ask, their sizes and the last trade. Level 2 data shows several price levels on each side, like the ladder above, so you can see the depth. The order book shows the queued trade waiting to happen, while stock charts show you past trades that already happened.
Example
What happens if you order more shares than what the top (best priced) seller has? Let's use the order book example above, and simulate what happens if you put a market order of 100 or 700 shares.
When you order 100 shares, the best ask has 200 shares at $50.02, so all 100 shares fill there. You pay 100 × $50.02 = $5,002.00, exactly the quoted ask.
The case is different with 700 shares. Because the best ask only has 200 shares, so the order keeps going up the ladder:
Price level
Shares filled
Cost
$50.02
200
$10,004.00
$50.03
300
$15,009.00
$50.04
200
$10,008.00
Total
700
$35,021.00
Therefore, if you order 700 share, you will have what is called by average fill price, or the total cost divided by total shares:
VWAP = sum of (price × shares) ÷ sum of shares = $35,021.00 ÷ 700 = $50.03 per share.
You saw a best ask of $50.02 but paid an average of $50.03. That is $0.01 more per share, or $7.00 over the whole order. This is why you want to pay attention if there is large gaps between orders.
Now, let's say you enter a limit order to buy 700 shares, but this time at no more than $50.02. What happens is:
200 shares fill immediately at $50.02 ($10,004.00).
The other 500 shares rest in the book as a new best bid at $50.02, and fill only if sellers come to you at that price.
You will never pay more than $50.02, but you may not get all 700 shares, or any more of them, if the price moves away.
To understand better, you can try using the book order simulator below:
Book Order Simulator
Walk the book order simulator
Depth, liquidity and the spread
An order book is called a thick book, if it has lots of shares at many prices close together. Oppositely, a thin book has few shares with larger gaps between price levels. A thin book means the price will move more, with small amount of orders.
Thick book
Thin book
Typical stock
Popularly traded companies
Niche companies
Spread
Small
Wide
Availability at best price
Large
Small
Volatility from big orders
Rather small
Rather large
Liquid stocks usually have tighter spreads and bigger books, because many buyers and sellers are competing. Small stocks have fewer participants, so the prices may be spread wider. You can also see a depth chart showing this as staircases. A steep climb means many shares are stacked in a narrow price range (thick). A long flat stretch means few shares across several prices (thin).
Order Book Imbalance
Order book imbalance is when there is significantly more resting buy size than sell size, or the other way around. You can measure this imbalance using a ratio formula:
What does order imbalance do? In a study of 50 US stocks, Cont, Kukanov and Stoikov found that over short time intervals, price changes are mainly driven by order flow imbalance at the best bid and ask. Also, this price effect is smaller when the book is deeper. The research is about tiny time windows, so it applies as an observation about the next few moments, not a forecast of where a stock goes over days or years.
You also can find information on imbalance data from stock exchanges themselves. Nasdaq, for example, publishes its Net Order Imbalance Indicator between 9:25 and 9:30 a.m. ET before the open and between 3:50 and 4:00 p.m. ET before the close, showing the buy or sell imbalance and an indicative price.
Note that sometimes a stock is traded in multiple places. A US stock, for example, trades on several exchanges and other venues at the same time (NYSE, Nasdaq, etc.), and each exchange keeps its own order book for the stock. The quote on most free screens combines the best bid and best ask found across all of them.
FAQ
What is an order book in stocks? A live list of everyone's waiting offers to buy and sell a stock, sorted by price, with the number of shares at each price.
What do the bid and ask sides show? The bid side shows what buyers will pay, highest first. The ask side shows what sellers want, lowest first.
What is the bid-ask spread, and how is it measured? It is the best ask minus the best bid. Divide by the midpoint to get a percentage. In the order book example above, $0.01 ÷ $50.015 is about 0.02%.
How do you read an order book step by step? Find the best bid and ask, measure the spread, check the size at each level, compare total bid and ask size near the top, and watch how it changes.
How are orders matched? By price-time priority on most US exchanges: the best price goes first, and at equal prices the earliest order goes first.
Why might my market order fill at a different price than the last price shown? A market order fills against the current best prices, not the last trade. If it is larger than the size at the best price, it moves on to worse prices.
What is the difference between a market order and a limit order? A market order takes available shares now and does not guarantee the price. A limit order guarantees your price or better but may not fill.
What is market depth, and what is the difference between Level 1 and Level 2? Depth is how many shares sit at each price. Level 1 shows only the best bid and ask and the last trade. Level 2 shows several price levels on each side.
What is order book imbalance, and can it predict price moves? It is more resting size on one side than the other near the top of the book. Research links order flow imbalance to price changes over very short intervals, but it is not a reliable forecast beyond that.
Why can't I see every order? Hidden and iceberg orders show only part of their size, displayed orders can be cancelled at any time, and each exchange has its own book, so one screen shows only part of the picture.
Do long-term investors need to look at the order book? Mostly not for small orders in busy stocks. Checking the spread before a market order is usually enough.
What does "order book" mean in a company's earnings report? It is a different concept: a backlog of customer orders the company has received but not yet delivered, such as a hardware maker's order book. It has nothing to do with the stock-trading ladder in this article.
Gotrade is the trading name of Gotrade Securities Inc., which is registered with and supervised by the Labuan Financial Services Authority (LFSA). This content is for educational purposes only and does not constitute financial advice. Always do your own research (DYOR) before investing.
Sindhu Partomo is a copywriter and content writer with 8+ years of experience in agencies, B2B, and SaaS. He has been writing about business and finance since 2023, and holds a bachelor degree from University of Indonesia.
Hendrie Saputra holds a Master of Business Administration (MBA) with a concentration in Business Risk & Finance, along with professional experience in finance, marketing, and project management. He is experienced in analyzing market data and developing research-driven business strategies.