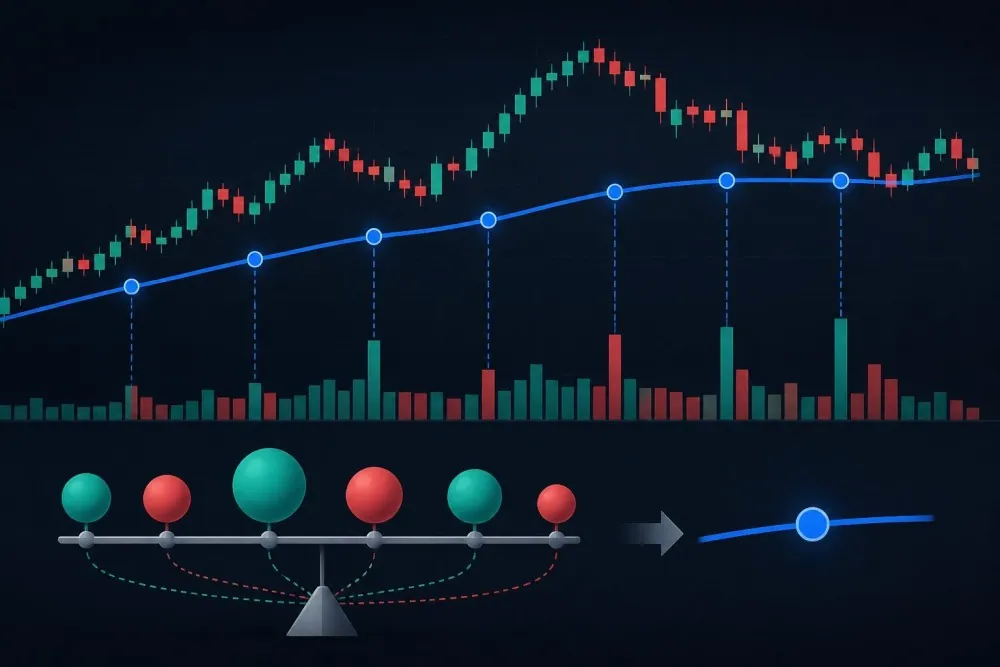
VWAP is the session average price, weighted by the volume traded.
It resets at every session open and only describes the current day.
Institutions use it to judge execution, not to predict price direction.
Price above VWAP shows intraday strength; below it shows weakness.
In Pine Script v5 the built-in function is ta.vwap, anchored by session.
VWAP might sound less familiar compared to other indicators, especially if you are new to the world of stock trading. But VWAP is widely used in trading, because it shows where the bulk of a session's trading actually happened. VWAP, or volume-weighted average price, is the average price a stock has traded at during a session weighted by volume. It is calculated as cumulative price times volume divided by cumulative volume. Most explanations treat it as a trading signal. That is the secondary use.
VWAP was built as a benchmark for measuring execution quality, and knowing that changes how you read it on a chart. In this article you will learn the calculation, the institutional purpose, the common strategies, and how it is written in Pine Script.
What Is VWAP?
VWAP stands for Volume Weighted Average Price, is the average price of every share traded in a session, with each price weighted by how much volume went through at that price.
Usually traders use it to determine the average price of an asset traded throughout the day because it reflects where most of the session's volume traded. Put this to an example, a simple average treats a trade of 10 shares the same as a trade of 100,000. VWAP does not, which is why it describes where the bulk of the day's business actually happened.
Traders read VWAP as a dividing line between bullish and bearish control within a session, so when a stock trades above its VWAP, buyers are generally paying more than the average participant has paid that day, which signals strength and sustained demand and when it trades below, sellers are in control and the average holder from that session is sitting on a loss. Because of this, VWAP often behaves like a dynamic support or resistance level.
VWAP also plays a major role in institutional execution such as large funds that need to buy or sell millions of shares cannot do so in a single order without moving the price against themselves, so they break orders into smaller pieces and measure their results against VWAP as a benchmark.
Price usually means the typical price of a bar, which is the high, low and close averaged, often written as hlc3. The worked example below uses four trades in one session.
Trade
Price
Volume
Price × volume
1
$10.00
100
$1,000
2
$10.20
200
$2,040
3
$10.10
150
$1,515
4
$10.30
50
$515
Total
500
$5,070
VWAP calculator
Dividing $5,070 by 500 shares gives a VWAP of $10.14. Illustrative figures. Note what the weighting did. The simple average of the four prices is $10.15, but the heaviest trade happened at $10.20, and the lightest at $10.30 barely moved the result.
How Is VWAP Different From a Moving Average?
Both draw a line through price, and they answer different questions.
Feature
VWAP
Moving average
Uses volume
Yes, volume is the weighting
No, every period counts equally
Lookback
Cumulative from the session open
Fixed number of periods, rolling
Resets
Every session
Never, it rolls continuously
Typical use
Intraday execution and bias
Trend over days, weeks or months
Early-session behaviour
Jumpy, few trades included
Stable, history already built
A 50-day moving average tells you about a trend. VWAP tells you whether you are buying above or below what the market paid today.
VWAP exists because large institutions needed a way to judge their own trading. A fund buying one million shares cannot place a single order without moving the price. It breaks the order into small pieces across the day.
Afterwards it asks a fair question. Did we pay more or less than the market average?VWAP answers it. Buying below the day's VWAP counts as good execution, and buying above it counts as poor execution.
Brokers sell this as a service. A VWAP algorithm slices a large order through the session, aiming to match the benchmark rather than to predict direction. That origin explains two things about the indicator. It is designed to measure a price already paid, not to forecast the next one.
It is also most meaningful on heavily traded stocks, where the benchmark reflects real activity.
How Do Traders Use VWAP?
Retail use is mostly about bias and reference levels. Four approaches cover what is usually taught.
1. Directional bias
Price above VWAP means buyers have been paying more than the session average, which is read as intraday strength. Below VWAP is read as weakness.
The limitation is obvious once stated. The line simply describes what has already happened, so it confirms rather than predicts.
2. Mean reversion
Some traders treat VWAP as a level price tends to return to, buying pullbacks to the line in an up session.
This works while the session is ranging and fails in a strong trend, when price can stay on one side of VWAP for hours.
3. VWAP bands
Bands are drawn a set number of standard deviations above and below VWAP, marking how far price has stretched from the session average.
They are used the way other volatility bands are used, as context for how extended a move is rather than as entry triggers.
4. Anchored VWAP
Anchored VWAP starts the calculation from a chosen point instead of the session open, such as an earnings date or a major high.
It answers a specific question: what has the average buyer paid since that event? Unlike session VWAP, it can span weeks. These are intraday techniques, and they sit inside the wider practice covered in our guide to day trading.
How Do You Code VWAP in Pine Script v5?
TradingView's Pine Script has VWAP built in, so there is no need to write the cumulative maths yourself.
The function is ta.vwap, and it comes in three forms. ta.vwap(source) returns the line. ta.vwap(source, anchor) lets you choose when the calculation restarts. ta.vwap(source, anchor, stdev_mult) returns the line plus an upper and lower band.
A minimal session VWAP looks like this.
//@version=5
indicator("Session VWAP", overlay = true)
plot(ta.vwap(hlc3))
Adding an anchor and bands takes a few more lines.
Two details catch people out. The default source is hlc3, the typical price, not the close, and the cumulative totals reset at every anchor boundary rather than rolling.
Code like this plots an indicator. It does not test whether the idea behind it makes money, which is a separate exercise.
What Is the Difference Between VWAP and TWAP?
TWAP stands for time-weighted average price. It averages price evenly across a period, ignoring how much volume traded at each point.
Feature
VWAP
TWAP
Weighting
By volume traded
By time elapsed
Reflects
Where the business actually happened
An even slice of the period
Best suited to
Liquid stocks with uneven volume
Thin stocks, or hiding order size
Volume in US stocks is heavily front and back loaded, with the open and close far busier than midday. VWAP captures that shape and TWAP deliberately ignores it.
Both exist as broker algorithms. A trader who wants to match the market's average picks VWAP, while one who wants a steady, predictable drip picks TWAP.
What Are VWAP's Limitations?
Four constraints matter more than any setting you can change.
First, it is backward-looking by construction. Every value is an average of trades already printed.
Second, it is unreliable early. In the first minutes of a session the line jumps around because so little volume has accumulated.
Third, it is intraday only. Session VWAP has no memory beyond today, which makes it useless for position sizing or valuation over months.
Fourth, it needs liquidity. On a thinly traded stock, a handful of trades can drag the benchmark somewhere that reflects nobody's real activity.
Should Long-Term Investors Pay Attention to VWAP?
Rarely, and only as an execution detail rather than a decision tool.
Suppose you have already decided to buy a company and are placing a sizeable order. Knowing where the session average sits can help you avoid paying up during a spike.
That is the legitimate version of VWAP for an investor. What it cannot do is tell you whether the company is worth owning. It contains no information about earnings, debt or growth.
It is also worth remembering what intensive intraday activity has cost most people. Barber and Odean studied 66,465 US households at a discount broker between 1991 and 1996 and found that the fifth who traded most earned 11.4% a year against 17.9% for the market.
For most investors the practical version is simpler. Use limit orders so you control the price you pay, and spend your research time on the business rather than the line. Gotrade gives access to US-listed stocks with fractional shares from $1. An order can be sized to your plan rather than to the share price.
Conclusion
Before using VWAP for anything, watch it for a few sessions without trading on it. Note how far it moves in the first ten minutes and how little it moves after lunch. That behaviour tells you what the line can and cannot do, which no indicator setting will change. VWAP was built to measure a price already paid, so treat it as a reference point rather than a forecast.
This content is for educational purposes only and is not investment advice or a recommendation to adopt any trading strategy. Trading carries risk, including the possible loss of principal, and short-term trading carries elevated risk. Code examples are illustrative and are not tested trading systems.
Gotrade is the trading name of Gotrade Securities Inc., which is registered with and supervised by the Labuan Financial Services Authority (LFSA). This content is for educational purposes only and does not constitute financial advice. Always do your own research (DYOR) before investing.
Muhammad Zhafran Tsany is a digital market with over years of experience, covering personal finance content since 2024, including stock market basics and beginner investing strategy for Rankia Indonesia. He holds a Bachelor of Business in Digital Business from Universitas Pendidikan Indonesia.
Hendrie Saputra holds a Master of Business Administration (MBA) with a concentration in Business Risk & Finance, along with professional experience in finance, marketing, and project management. He is experienced in analyzing market data and developing research-driven business strategies.