
Core Laboratories NV (CLB) Stock
Key stats
- Market cap
- $414.24M
- Price / Earnings ratio
- 26.4x
- EPS (TTM)
- $0.34
- Volume
- Loading
- 52-week high
- $20.36
- 52-week low
- $8.61
- Dividend yield
- 0.44%
- Dividend amount (latest)
- $0.01
Source: third-party data provider, as of November 13, 2026
Compare with CLB
Recent news

CLB Q3 Earnings Miss Estimates on Higher Costs and Disruptions
CLB Q3 Earnings Miss Estimates on Higher Costs and Disruptions
CLB
Core Laboratories Q3 Earnings Call Highlights
Core Laboratories Q3 Earnings Call Highlights
CLB
Core Laboratories (CLB) Q3 Earnings Miss Estimates
Core Laboratories (CLB) Q3 Earnings Miss Estimates
CLB
CLB Declines 35% in the Past Six Months: How to Play the Stock?
CLB Declines 35% in the Past Six Months: How to Play the Stock?
CLBNews tone: automated (AI) classification of the article's content, not a price prediction.
Technical indicators
- RSI 14
- 36.15
- MACD 12/26/9
- -0.39
- EMA 9 of MACD
- -0.30
- MACD histogram
- -0.09
- SMA 50
- $10.52
- Price below SMA 50
- EMA 50
- $10.34
- Price below EMA 50
- SMA 200
- $13.46
- Price below SMA 200
- EMA 200
- $13.22
- Price below EMA 200
Calculated by Gotrade from daily closing prices, as of November 11, 2026. Technical data, not a recommendation.
Analyst ratings
No analyst data available
Financials
Performance
Debt & Balance Sheet
Revenue to Profit
2025Earnings
No data available
Source: third-party data provider
Latest news
CLB Q3 Earnings Miss Estimates on Higher Costs and Disruptions
CLB Q3 Earnings Miss Estimates on Higher Costs and Disruptions
CLBCore Laboratories Q3 Earnings Call Highlights
Core Laboratories Q3 Earnings Call Highlights
CLBCore Laboratories (CLB) Q3 Earnings Miss Estimates
Core Laboratories (CLB) Q3 Earnings Miss Estimates
CLBCLB Declines 35% in the Past Six Months: How to Play the Stock?
CLB Declines 35% in the Past Six Months: How to Play the Stock?
CLB
3 Oilfield Services Stocks Poised to Gain Despite Industry Challenges
3 Oilfield Services Stocks Poised to Gain Despite Industry Challenges
CLB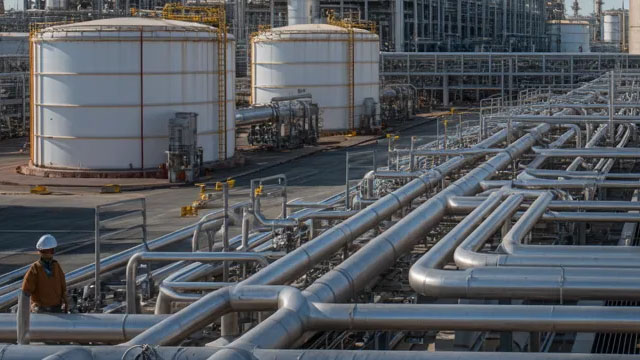
Core Laboratories (CLB) Up 18.7% Since Last Earnings Report: Can It Continue?
Core Laboratories (CLB) Up 18.7% Since Last Earnings Report: Can It Continue?
CLB
DTI or CLB: Which Is the Better Value Stock Right Now?
DTI or CLB: Which Is the Better Value Stock Right Now?
CLB
Is CLB Stock Attractive After Its Sharp Selloff and Mixed Q2 Results?
Is CLB Stock Attractive After Its Sharp Selloff and Mixed Q2 Results?
CLB
Core Laboratories Q2 Earnings Beat Estimates, Decline Y/Y
Core Laboratories Q2 Earnings Beat Estimates, Decline Y/Y
CLB
Core Laboratories Q2 Earnings Call Highlights
Core Laboratories Q2 Earnings Call Highlights
CLBNews tone: automated (AI) classification of the article's content, not a price prediction.
About Core Laboratories NV
Core Laboratories N.V. provides reservoir description, production enhancement and reservoir management services to the oil and gas industry. The Company operates through three segments: Reservoir Description, Production Enhancement and Reservoir Management. The Reservoir Description segment encompasses the characterization of petroleum reservoir rock, fluid and gas samples. It provides analytical and field services to characterize properties of crude oil and petroleum products to the oil and gas industry. The Production Enhancement segment includes products and services relating to reservoir well completions, perforations, stimulations and production. It provides integrated diagnostic services to evaluate the effectiveness of well completions. The Reservoir Management segment combines and integrates information from reservoir description and production enhancement services to increase production and recovery of oil and gas from its clients' reservoirs.
Key Executives
| Name | Title | Year Born |
|---|---|---|
| Mr. Lawrence V. Bruno | Chairman of the Board, CEO, President & COO | 1960 |
| Mr. Christopher Scott Hill | Senior VP & CFO | 1970 |
| Ms. Gwendolyn Y. Gresham M.B.A. | Senior Vice President of Corporate Development & Investor Relations | 1968 |
| Mr. Mark Damian Tattoli J.D. | Senior VP, Secretary & General Counsel | 1972 |
| Mr. Sow Hang Teo | VP, Treasurer & Chief Accounting Officer | 1970 |
| Leslie D. Linklater | Vice President of People, Organization & Culture | — |
Fundamentals
Valuation
Profitability
Trading
Dividend
Source: third-party data provider, as of November 13, 2026
Technical indicators
- RSI 14
- 36.15
- MACD 12/26/9
- -0.39
- EMA 9 of MACD
- -0.30
- MACD histogram
- -0.09
- SMA 50
- $10.52
- Price below SMA 50
- EMA 50
- $10.34
- Price below EMA 50
- SMA 200
- $13.46
- Price below SMA 200
- EMA 200
- $13.22
- Price below EMA 200
Calculated by Gotrade from daily closing prices, as of November 11, 2026. Technical data, not a recommendation.
Analyst views
No analyst data available
Seasonality
Monthly price change (%)| Jan | Feb | Mar | Apr | May | Jun | Jul | Aug | Sep | Oct | Nov | Dec | |
|---|---|---|---|---|---|---|---|---|---|---|---|---|
| 2021 | -13.6 | -0.4 | ||||||||||
| 2022 | +9.2 | -0.4 | +15.0 | -19.8 | +10.6 | -31.1 | -4.5 | -10.4 | -16.6 | +31.0 | +10.1 | -5.7 |
| 2023 | +34.1 | -7.4 | -15.4 | -4.5 | -0.7 | -0.4 | +16.5 | -12.4 | -3.7 | -8.2 | -15.7 | -2.3 |
| 2024 | -9.8 | -0.4 | +10.5 | -7.8 | +19.3 | +13.3 | +9.0 | |||||
| 2026 | +3.7 | -16.0 | -8.0 | +16.1 | -21.7 | +9.0 | -11.3 |