
SLB Limited (SLB) Stock
Key stats
- Market cap
- $79.82B
- Price / Earnings ratio
- 23.7x
- EPS (TTM)
- $2.08
- Volume
- Loading
- 52-week high
- $60.46
- 52-week low
- $34.65
- Dividend yield
- 2.21%
- Dividend amount (latest)
- $0.30
- EPS vs analyst estimate
- +3.0%Q3 FY25 · $0.69 vs $0.67
Source: third-party data provider, as of October 28, 2026
EPS estimate: analyst consensus
Compare with SLB
Recent news

SLB (SLB) Reliance on International Sales: What Investors Need to Know
SLB (SLB) Reliance on International Sales: What Investors Need to Know
SLB
What SLB (SLB) Said on Its Q3 Earnings Call
What SLB (SLB) Said on Its Q3 Earnings Call
SLB
SLB Q3 Earnings & Revenues Beat Estimates on Production Systems Growth
SLB Q3 Earnings & Revenues Beat Estimates on Production Systems Growth
SLB
SLB (SLB) Q3 Earnings and Revenues Surpass Estimates
SLB (SLB) Q3 Earnings and Revenues Surpass Estimates
SLBNews tone: automated (AI) classification of the article's content, not a price prediction.
Technical indicators
- RSI 14
- 63.43
- MACD 12/26/9
- 0.19
- EMA 9 of MACD
- -0.52
- MACD histogram
- 0.71
- SMA 50
- $52.46
- Price above SMA 50
- EMA 50
- $51.31
- Price above EMA 50
- SMA 200
- $51.34
- Price above SMA 200
- EMA 200
- $49.46
- Price above EMA 200
Calculated by Gotrade from daily closing prices, as of October 27, 2026. Technical data, not a recommendation.
Analyst ratings
Analyst consensus: Buy
Based on 5 analyst ratings
Third-party analyst opinion, not a recommendation from Gotrade.
Financials
Performance
Debt & Balance Sheet
Revenue to Profit
2025Earnings
The market is expecting earnings per share of $0.75 for this quarter. The company has not yet shared when it is announcing earnings.
Source: third-party data provider
Latest news
SLB (SLB) Reliance on International Sales: What Investors Need to Know
SLB (SLB) Reliance on International Sales: What Investors Need to Know
SLBWhat SLB (SLB) Said on Its Q3 Earnings Call
What SLB (SLB) Said on Its Q3 Earnings Call
SLBSLB Q3 Earnings & Revenues Beat Estimates on Production Systems Growth
SLB Q3 Earnings & Revenues Beat Estimates on Production Systems Growth
SLBSLB (SLB) Q3 Earnings and Revenues Surpass Estimates
SLB (SLB) Q3 Earnings and Revenues Surpass Estimates
SLB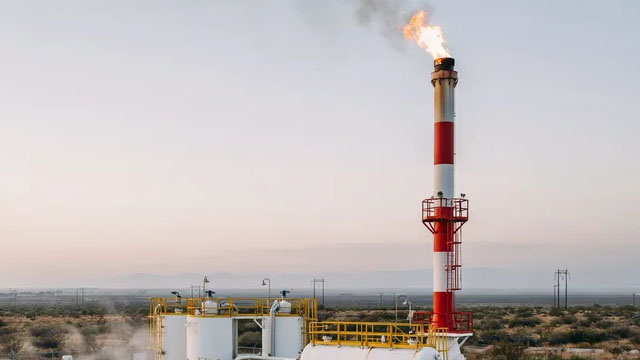
Top oilfield services firm SLB beats quarterly profit estimates
Top oilfield services firm SLB beats quarterly profit estimates
SLB
SLB Announces Third-Quarter 2026 Results
SLB Announces Third-Quarter 2026 Results
SLB
Wall Street Analysts Think SLB (SLB) Is a Good Investment: Is It?
Wall Street Analysts Think SLB (SLB) Is a Good Investment: Is It?
SLB
Can SLB Stock Extend Its Winning Streak With Strong Q3 Earnings?
Can SLB Stock Extend Its Winning Streak With Strong Q3 Earnings?
SLB
SLB (SLB) Gains As Market Dips: What You Should Know
SLB (SLB) Gains As Market Dips: What You Should Know
SLB
Earnings Preview: SLB (SLB) Q3 Earnings Expected to Decline
Earnings Preview: SLB (SLB) Q3 Earnings Expected to Decline
SLBNews tone: automated (AI) classification of the article's content, not a price prediction.
About SLB Limited
Our story begins with what it truly means to be a technology innovator. We supply the industry’s most comprehensive range of products and services, from exploration through production, and integrated pore-to-pipeline solutions that optimize hydrocarbon recovery to deliver reservoir performance sustainably.
Key Executives
| Name | Title | Year Born |
|---|---|---|
| Mr. Olivier Le Peuch | CEO & Director | 1964 |
| Mr. Stephane Biguet | Executive VP & CFO | 1969 |
| Mr. Demosthenis Pafitis | Chief Technology Officer | 1968 |
| Ms. Dianne B. Ralston J.D. | Chief Legal Officer & Secretary | 1967 |
| Mr. Abdellah Merad | Executive Vice President of Core Services & Equipment | 1974 |
| Mr. Howard Guild | Chief Accounting Officer | 1972 |
| Mr. Sebastien Lehnherr | Chief Information Officer | — |
| Mr. James R. McDonald | Senior Vice President of Investor Relations & Industry Affairs | 1979 |
| Giles Powell | Director of Corporate Communication | — |
| Ms. Aparna Raman | Chief Strategy & Marketing Officer | 1975 |
Fundamentals
Valuation
Profitability
Trading
Dividend
Source: third-party data provider, as of October 28, 2026
Technical indicators
- RSI 14
- 63.43
- MACD 12/26/9
- 0.19
- EMA 9 of MACD
- -0.52
- MACD histogram
- 0.71
- SMA 50
- $52.46
- Price above SMA 50
- EMA 50
- $51.31
- Price above EMA 50
- SMA 200
- $51.34
- Price above SMA 200
- EMA 200
- $49.46
- Price above EMA 200
Calculated by Gotrade from daily closing prices, as of October 27, 2026. Technical data, not a recommendation.
Analyst views
5 analyst ratings
Third-party analyst opinion, not a recommendation from Gotrade.
- Low
- $48.00
- Average
- $61.60
- High
- $70.00
Seasonality
Monthly price change (%)| Jan | Feb | Mar | Apr | May | Jun | Jul | Aug | Sep | Oct | Nov | Dec | |
|---|---|---|---|---|---|---|---|---|---|---|---|---|
| 2021 | +0.0 | -13.9 | +5.5 | |||||||||
| 2022 | +23.2 | -0.7 | +9.7 | -6.4 | +17.5 | -23.4 | +3.9 | +4.8 | -2.6 | +35.8 | +0.0 | +3.3 |
| 2023 | +10.6 | -4.5 | -10.5 | -5.7 | -12.9 | +9.2 | +17.9 | +2.3 | -3.0 | -3.9 | -6.8 | -0.7 |
| 2024 | -6.3 | -1.4 | +11.1 | -14.0 | -2.7 | +7.1 | +3.7 | -5.7 | -0.8 | -7.1 | +10.5 | -12.1 |
| 2025 | +4.9 | +3.7 | +5.0 | -21.2 | -2.0 | +1.4 | -4.0 | +11.5 | -4.3 | +2.8 | -2.1 | +4.9 |
| 2026 | +20.3 | +6.8 | +0.2 | +13.7 | -4.2 | -15.1 | +10.0 | +21.9 | -14.8 | +11.1 |