
Compass Minerals International Inc. (CMP) Stock
Key stats
- Market cap
- $948.35M
- Price / Earnings ratio
- 50.6x
- EPS (TTM)
- $0.43
- Volume
- Loading
- 52-week high
- $34.50
- 52-week low
- $16.40
Source: third-party data provider, as of October 17, 2026
Compare with CMP
Recent news

Compass Minerals Comments on Salt Exclusion from Section 338 Tariffs
Compass Minerals Comments on Salt Exclusion from Section 338 Tariffs
CMP
3 Reasons Growth Investors Will Love Compass (CMP)
3 Reasons Growth Investors Will Love Compass (CMP)
CMP
Here is Why Growth Investors Should Buy Compass (CMP) Now
Here is Why Growth Investors Should Buy Compass (CMP) Now
CMP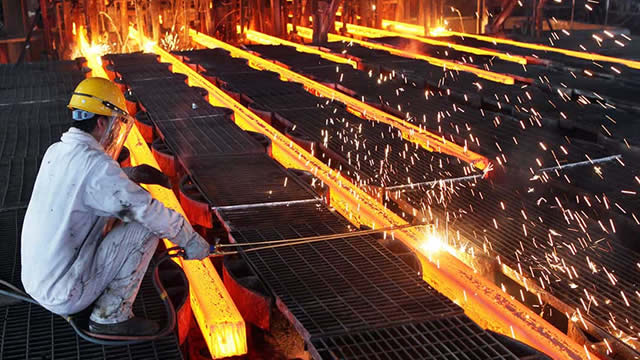
Compass Minerals International Q3 Earnings Call Highlights
Compass Minerals International Q3 Earnings Call Highlights
CMPTechnical indicators
- RSI 14
- 42.57
- MACD 12/26/9
- -0.53
- EMA 9 of MACD
- -0.66
- MACD histogram
- 0.14
- SMA 50
- $24.27
- Price below SMA 50
- EMA 50
- $24.35
- Price below EMA 50
- SMA 200
- $25.92
- Price below SMA 200
- EMA 200
- $24.29
- Price below EMA 200
Calculated by Gotrade from daily closing prices, as of October 15, 2026. Technical data, not a recommendation.
Analyst ratings
Analyst consensus: Sell
Based on 2 analyst ratings
Third-party analyst opinion, not a recommendation from Gotrade.
Financials
Performance
Debt & Balance Sheet
Revenue to Profit
2025Earnings
The market is expecting earnings per share of $0.03 for this quarter. The company has not yet shared when it is announcing earnings.
Source: third-party data provider
Latest news
Compass Minerals Comments on Salt Exclusion from Section 338 Tariffs
Compass Minerals Comments on Salt Exclusion from Section 338 Tariffs
CMP3 Reasons Growth Investors Will Love Compass (CMP)
3 Reasons Growth Investors Will Love Compass (CMP)
CMPHere is Why Growth Investors Should Buy Compass (CMP) Now
Here is Why Growth Investors Should Buy Compass (CMP) Now
CMPCompass Minerals International Q3 Earnings Call Highlights
Compass Minerals International Q3 Earnings Call Highlights
CMP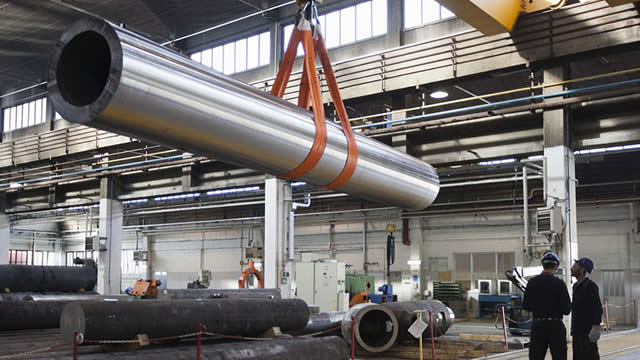
Compass Minerals (CMP) Reports Q3 Loss, Tops Revenue Estimates
Compass Minerals (CMP) Reports Q3 Loss, Tops Revenue Estimates
CMP
Compass Minerals Announces Change in Operations Leadership
Compass Minerals Announces Change in Operations Leadership
CMP
Compass Minerals Reports Fiscal 2026 Third-Quarter Results
Compass Minerals Reports Fiscal 2026 Third-Quarter Results
CMP
Compass Minerals Announces Conference Call to Discuss Third Quarter Fiscal 2026 Results
Compass Minerals Announces Conference Call to Discuss Third Quarter Fiscal 2026 Results
CMP
Compass Minerals Announces S&P Global Ratings Upgrade to B+
Compass Minerals Announces S&P Global Ratings Upgrade to B+
CMP
Ketch Named Grid Leader in G2 Summer 2026 Reports, Signaling Market Momentum and Enterprise Customer Trust
Ketch Named Grid Leader in G2 Summer 2026 Reports, Signaling Market Momentum and Enterprise Customer Trust
CMPAbout Compass Minerals International Inc.
Compass Minerals currently produces two primary products: salt and specialty potash fertilizer. The company's main assets include rock salt mines in Ontario, Louisiana, and the United Kingdom. The fertilizer is produced from a brine operation at the Great Salt Lake in Utah that produces sulfate of potash and magnesium chloride. Compass' salt products are used for deicing and also by industrial and consumer end markets. The firm's sulfate of potash is used by growers of high-value crops that are sensitive to standard potash.
Key Executives
| Name | Title | Year Born |
|---|---|---|
| Dr. Edward C. Dowling Jr., B.Sc., M.Sc., Ph.D. | President, CEO & Director | 1955 |
| Mr. Peter Fjellman | Chief Financial Officer | 1970 |
| Mr. Brandon Risner | Chief Operating Officer | 1975 |
| Ms. Amy Tills | Chief Human Resources Officer | 1978 |
| Mr. Benjamin Nichols | Chief Commercial Officer | 1982 |
| Ms. Ashley Ward | Chief Accounting Officer | 1985 |
| Mr. Brent Collins | Vice President, Treasurer & Investor Relations | — |
| Mr. James D. Hughes | VP, General Counsel & Corporate Secretary | — |
Fundamentals
Valuation
Profitability
Trading
Dividend
Source: third-party data provider, as of October 17, 2026
Technical indicators
- RSI 14
- 42.57
- MACD 12/26/9
- -0.53
- EMA 9 of MACD
- -0.66
- MACD histogram
- 0.14
- SMA 50
- $24.27
- Price below SMA 50
- EMA 50
- $24.35
- Price below EMA 50
- SMA 200
- $25.92
- Price below SMA 200
- EMA 200
- $24.29
- Price below EMA 200
Calculated by Gotrade from daily closing prices, as of October 15, 2026. Technical data, not a recommendation.
Analyst views
2 analyst ratings
Third-party analyst opinion, not a recommendation from Gotrade.
- Low
- $27.00
- Average
- $29.50
- High
- $32.00
Seasonality
Monthly price change (%)| Jan | Feb | Mar | Apr | May | Jun | Jul | Aug | Sep | Oct | Nov | Dec | |
|---|---|---|---|---|---|---|---|---|---|---|---|---|
| 2021 | -10.4 | -29.7 | +5.0 | |||||||||
| 2022 | +1.8 | +7.7 | +11.4 | -7.3 | -23.1 | -19.1 | +8.7 | +9.6 | -3.1 | -1.5 | +10.8 | -6.4 |
| 2023 | +12.0 | -15.6 | -12.2 | -4.9 | -2.2 | +7.2 | +10.3 | -22.2 | -8.7 | -9.1 | -3.9 | +0.0 |
| 2024 | -9.7 | -0.7 | -33.2 | -20.0 | +6.7 | -21.8 | +32.2 | -29.2 | +47.7 | -0.1 | +28.0 | -25.4 |
| 2025 | +6.1 | -9.1 | -7.4 | +47.4 | +47.8 | +5.5 | -6.5 | -3.7 | +0.9 | -12.6 | +10.1 | +3.0 |
| 2026 | +25.8 | +0.2 | -7.6 | +14.2 | +21.6 | -7.1 | -4.2 | -13.6 | -9.8 | +3.6 |










