Darling Ingredients (DAR) Stock
Key stats
- Market cap
- $8.39B
- Price / Earnings ratio
- 9.4x
- EPS (TTM)
- $5.35
- Volume
- Loading
- 52-week high
- $69.98
- 52-week low
- $31.81
Source: third-party data provider, as of November 13, 2026
Compare with DAR
Recent news
What Darling Ingredients (DAR) Said on Its Q3 Earnings Call
What Darling Ingredients (DAR) Said on Its Q3 Earnings Call
DAR
DAR Q3 Earnings Surpass Estimates on Solid Feed Performance
DAR Q3 Earnings Surpass Estimates on Solid Feed Performance
DAR
Here's What Key Metrics Tell Us About Darling (DAR) Q3 Earnings
Here's What Key Metrics Tell Us About Darling (DAR) Q3 Earnings
DAR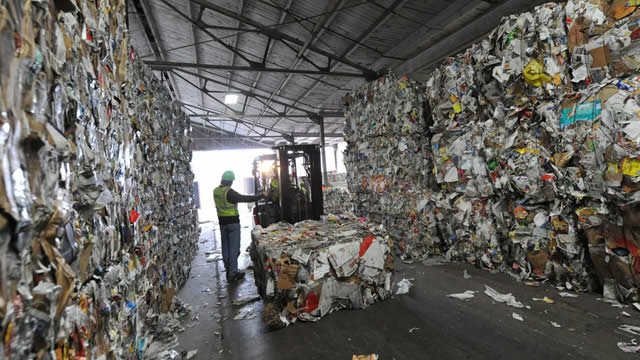
Darling Ingredients (DAR) Q3 Earnings and Revenues Surpass Estimates
Darling Ingredients (DAR) Q3 Earnings and Revenues Surpass Estimates
DARNews tone: automated (AI) classification of the article's content, not a price prediction.
Technical indicators
- RSI 14
- 43.62
- MACD 12/26/9
- -2.40
- EMA 9 of MACD
- -2.34
- MACD histogram
- -0.07
- SMA 50
- $60.25
- Price below SMA 50
- EMA 50
- $58.34
- Price below EMA 50
- SMA 200
- $58.89
- Price below SMA 200
- EMA 200
- $55.62
- Price below EMA 200
Calculated by Gotrade from daily closing prices, as of November 11, 2026. Technical data, not a recommendation.
Analyst ratings
Analyst consensus: Buy
Based on 2 analyst ratings
Third-party analyst opinion, not a recommendation from Gotrade.
Financials
Performance
Debt & Balance Sheet
Revenue to Profit
2025Earnings
The market is expecting earnings per share of $0.78 for this quarter. The company has not yet shared when it is announcing earnings.
Source: third-party data provider
Latest news
What Darling Ingredients (DAR) Said on Its Q3 Earnings Call
What Darling Ingredients (DAR) Said on Its Q3 Earnings Call
DARDAR Q3 Earnings Surpass Estimates on Solid Feed Performance
DAR Q3 Earnings Surpass Estimates on Solid Feed Performance
DARHere's What Key Metrics Tell Us About Darling (DAR) Q3 Earnings
Here's What Key Metrics Tell Us About Darling (DAR) Q3 Earnings
DARDarling Ingredients (DAR) Q3 Earnings and Revenues Surpass Estimates
Darling Ingredients (DAR) Q3 Earnings and Revenues Surpass Estimates
DAR
Darling Ingredients Inc. Reports Third Quarter 2026 Results
Darling Ingredients Inc. Reports Third Quarter 2026 Results
DAR
Darling (DAR) Upgraded to Buy: Here's What You Should Know
Darling (DAR) Upgraded to Buy: Here's What You Should Know
DAR
What's in the Cards for Darling Ingredients in Q3 Earnings Release?
What's in the Cards for Darling Ingredients in Q3 Earnings Release?
DAR
Darling Ingredients (DAR) Reports Next Week: Wall Street Expects Earnings Growth
Darling Ingredients (DAR) Reports Next Week: Wall Street Expects Earnings Growth
DAR
Darling Ingredients Issues Statement on Third Quarter 2026 Earnings; Guidance for Fiscal Year 2026
Darling Ingredients Issues Statement on Third Quarter 2026 Earnings; Guidance for Fiscal Year 2026
DAR
Darling Ingredients Introduces Nextida® NxCogni™, the First Targeted Collagen Peptide Designed to Support Clarity and Cognitive Resilience
Darling Ingredients Introduces Nextida® NxCogni™, the First Targeted Collagen Peptide Designed to Support Clarity and Cognitive Resilience
DARNews tone: automated (AI) classification of the article's content, not a price prediction.
About Darling Ingredients
Darling Ingredients Inc develops and manufactures sustainable ingredients for customers in the pharmaceutical, food, pet food, fuel, and fertilizer industries. It collects and transforms all aspects of animal by-product streams into ingredients, including gelatin, fats, proteins, pet food ingredients, fertilizers. Also, the company recovers and converts used cooking oil and bakery remnants into feed and fuel ingredients. Darling has three primary business segments which are feed ingredients contributing the majority of revenue, food ingredients, and fuel ingredients. It provides grease trap services for food businesses and sells various equipment for collecting and delivering cooking oil. The company derives the majority of its revenue from customers in North America.
Key Executives
| Name | Title | Year Born |
|---|---|---|
| Mr. Randall C. Stuewe Randy | Chairman & CEO | 1963 |
| Mr. Robert W. Day | Executive VP & CFO | 1970 |
| Mr. John F. Sterling | Senior Advisor | 1964 |
| Mr. Jan van der Velden | Executive Vice President of International Rendering & Specialties | 1964 |
| Mr. Carlos Esteban Paz | Executive Vice President of Renewables, North American Specialty and Global Risk Mgmt | 1972 |
| Mr. Joseph Manzi | VP, Global Controller & Chief Accounting Officer | 1966 |
| Mr. Patrick McNutt | Executive VP & Chief Administrative Officer | 1960 |
| Ms. Suann Guthrie | Senior Vice President of Investor Relations & Global Affairs | — |
| Mr. Nick Kemphaus | EVP, General Counsel & Secretary | 1979 |
| Ms. Sandra Dudley | Executive VP of M&A and AI and Chief Strategy Officer | 1973 |
Fundamentals
Valuation
Profitability
Trading
Source: third-party data provider, as of November 13, 2026
Technical indicators
- RSI 14
- 43.62
- MACD 12/26/9
- -2.40
- EMA 9 of MACD
- -2.34
- MACD histogram
- -0.07
- SMA 50
- $60.25
- Price below SMA 50
- EMA 50
- $58.34
- Price below EMA 50
- SMA 200
- $58.89
- Price below SMA 200
- EMA 200
- $55.62
- Price below EMA 200
Calculated by Gotrade from daily closing prices, as of November 11, 2026. Technical data, not a recommendation.
Analyst views
2 analyst ratings
Third-party analyst opinion, not a recommendation from Gotrade.
- Low
- $83.00
- Average
- $85.50
- High
- $88.00
Seasonality
Monthly price change (%)| Jan | Feb | Mar | Apr | May | Jun | Jul | Aug | Sep | Oct | Nov | Dec | |
|---|---|---|---|---|---|---|---|---|---|---|---|---|
| 2021 | -13.1 | +6.5 | ||||||||||
| 2022 | -8.7 | +13.4 | +4.4 | -11.8 | +5.9 | -26.2 | +10.6 | +8.1 | -12.1 | +13.8 | -9.2 | -3.1 |
| 2023 | +8.7 | -6.2 | -8.7 | +1.0 | +7.4 | +0.9 | +8.0 | -10.1 | -15.7 | -12.7 | +0.4 | +10.1 |
| 2024 | -14.2 | -2.8 | +6.5 | -6.7 | -3.8 | -7.9 | +10.5 | +7.2 | -7.9 | +6.8 | +2.9 | -15.2 |
| 2025 | +9.2 | -0.7 | -9.2 | -0.2 | -4.8 | +23.2 | -15.0 | +7.8 | -6.3 | +2.2 | +11.6 | -2.1 |
| 2026 | +21.3 | +12.3 | +14.1 | +3.3 | -7.3 | -9.6 | +7.2 | +10.9 | -10.3 | -9.6 | +0.3 |