Denison Mines Corp (DNN) Stock
AMEX · DNN
Key stats
- Market cap
- $1.98B
- Price / Earnings ratio
- -47.7x
- EPS (TTM)
- -$0.04
- Volume
- Loading
- 52-week high
- $4.43
- 52-week low
- $1.94
Source: third-party data provider, as of November 13, 2026
Compare with DNN
Recent news
24/7 Wall Street
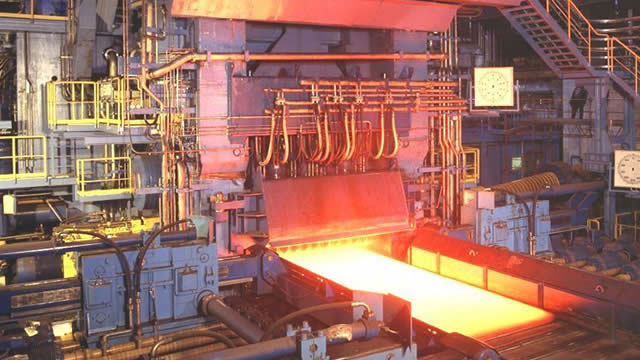
Every New Reactor Needs Fuel: 3 Uranium Stocks Positioned for the Nuclear Buildout
NeutralDNNSeptember 19, 2026
24/7 Wall StreetNeutral
Every New Reactor Needs Fuel: 3 Uranium Stocks Positioned for the Nuclear Buildout
DNN
Zacks Investment Research
Cameco vs. Denison: Which Uranium Stock Has an Edge Right Now?
DNNAugust 24, 2026
Zacks Investment Research
Cameco vs. Denison: Which Uranium Stock Has an Edge Right Now?
DNN
Zacks Investment Research
Denison Mine (DNN) Reports Q2 Loss, Misses Revenue Estimates
DNNAugust 12, 2026
Zacks Investment Research
Denison Mine (DNN) Reports Q2 Loss, Misses Revenue Estimates
DNN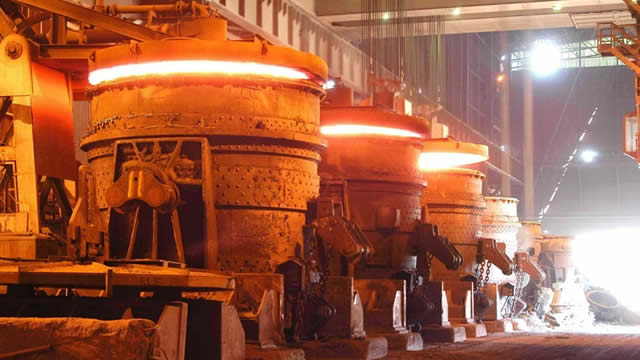
Zacks Investment Research
Nuclear Energy Stocks Gain From Growing Need for Reliable Clean Power
DNNJune 16, 2026
Zacks Investment Research
Nuclear Energy Stocks Gain From Growing Need for Reliable Clean Power
DNNNews tone: automated (AI) classification of the article's content, not a price prediction.
Technical indicators
- RSI 14
- 43.44
- MACD 12/26/9
- -0.10
- EMA 9 of MACD
- -0.12
- MACD histogram
- 0.02
- SMA 50
- $2.57
- Price below SMA 50
- EMA 50
- $2.51
- Price below EMA 50
- SMA 200
- $3.26
- Price below SMA 200
- EMA 200
- $3.02
- Price below EMA 200
Calculated by Gotrade from daily closing prices, as of November 11, 2026. Technical data, not a recommendation.
Analyst ratings
No analyst data available
Financials
Performance
Revenue
Net income
Net margin %
2021
2022
2023
2024
2025
108M72M36M0
Debt & Balance Sheet
Total assets
Total liabilities
2021
2022
2023
2024
2025
1B876M438M0
Revenue to Profit
2025$3.6M
Revenue$0.0
Cost of revenue$-742000.0
Gross profit$0.0
Operating expenses$-217.3M
Net incomeEarnings
No data available
Source: third-party data provider
Latest news
24/7 Wall Street
Every New Reactor Needs Fuel: 3 Uranium Stocks Positioned for the Nuclear Buildout
NeutralDNNSeptember 19, 2026
24/7 Wall StreetNeutral
Every New Reactor Needs Fuel: 3 Uranium Stocks Positioned for the Nuclear Buildout
DNNZacks Investment Research
Cameco vs. Denison: Which Uranium Stock Has an Edge Right Now?
DNNAugust 24, 2026
Zacks Investment Research
Cameco vs. Denison: Which Uranium Stock Has an Edge Right Now?
DNNZacks Investment Research
Denison Mine (DNN) Reports Q2 Loss, Misses Revenue Estimates
DNNAugust 12, 2026
Zacks Investment Research
Denison Mine (DNN) Reports Q2 Loss, Misses Revenue Estimates
DNNZacks Investment Research
Nuclear Energy Stocks Gain From Growing Need for Reliable Clean Power
DNNJune 16, 2026
Zacks Investment Research
Nuclear Energy Stocks Gain From Growing Need for Reliable Clean Power
DNN
Zacks Investment Research
Can DNN's Growing Uranium Contracts Drive Future Growth?
DNNMay 27, 2026
Zacks Investment Research
Can DNN's Growing Uranium Contracts Drive Future Growth?
DNN
Zacks Investment Research
DNN vs. CCJ: Which Uranium Stock Offers Better Opportunity Today?
DNNMay 20, 2026
Zacks Investment Research
DNN vs. CCJ: Which Uranium Stock Offers Better Opportunity Today?
DNN
Zacks Investment Research
Can Denison Mines Advance Phoenix With Uranium-Backed Funding Plan?
DNNMay 15, 2026
Zacks Investment Research
Can Denison Mines Advance Phoenix With Uranium-Backed Funding Plan?
DNN
Zacks Investment Research
Denison Mine (DNN) Reports Q1 Loss, Lags Revenue Estimates
DNNMay 13, 2026
Zacks Investment Research
Denison Mine (DNN) Reports Q1 Loss, Lags Revenue Estimates
DNN
Zacks Investment Research
DNN Stock Trades at Premium Value: Should You Buy, Hold or Sell?
DNNMay 11, 2026
Zacks Investment Research
DNN Stock Trades at Premium Value: Should You Buy, Hold or Sell?
DNN
Zacks Investment Research
Is Denison Mine Corp (DNN) Stock Outpacing Its Basic Materials Peers This Year?
DNNMay 11, 2026
Zacks Investment Research
Is Denison Mine Corp (DNN) Stock Outpacing Its Basic Materials Peers This Year?
DNNNews tone: automated (AI) classification of the article's content, not a price prediction.
About Denison Mines Corp
No description available.
SectorBasic Materials
IndustryUranium
CEOMr. David Daniel Cates C.A., C.P.A., MAcc
IPO DateMay 16, 1997
HeadquartersToronto, ON
Key Executives
| Name | Title | Year Born |
|---|---|---|
| Mr. David Daniel Cates C.A., C.P.A., MAcc | President, CEO & Director | 1982 |
| Ms. Elizabeth Sidle C.A., CPA | VP of Finance & CFO | 1981 |
| Ms. Amanda Willett | VP of Legal & Corporate Secretary | 1979 |
| Mr. Geoffrey G. Smith | Vice President of Corporate Development & Commercial | — |
| Mr. Chad Sorba | Vice President of Technical Services & Project Evaluation | — |
| Mr. David Bronkhorst P. Eng., P.Eng. | Interim Vice President Operations | — |
| Ms. Mary Joanne Smith | Vice President of Human Resources & Administration | — |
| Ms. Sophia Shane | Investor Relations | 1962 |
| Ms. Janna Switzer | Vice President of Environment, Sustainability & Regulatory | — |
Fundamentals
Valuation
Price-to-sales ratio559.95
Price-to-book value7.66
PEG ratio106.92
Profitability
Return on Equity-84.00%
Return on Assets-25.00%
Return on Sales-1497.00%
Gross margin (latest quarter)-99.21%
EBITDA$-24.40M
Trading
Average volume27,624,419
Dividend
Ex dividend date2 Jul 2012
Source: third-party data provider, as of November 13, 2026
Technical indicators
- RSI 14
- 43.44
- MACD 12/26/9
- -0.10
- EMA 9 of MACD
- -0.12
- MACD histogram
- 0.02
- SMA 50
- $2.57
- Price below SMA 50
- EMA 50
- $2.51
- Price below EMA 50
- SMA 200
- $3.26
- Price below SMA 200
- EMA 200
- $3.02
- Price below EMA 200
Calculated by Gotrade from daily closing prices, as of November 11, 2026. Technical data, not a recommendation.
Analyst views
No analyst data available
Seasonality
Monthly price change (%)| Jan | Feb | Mar | Apr | May | Jun | Jul | Aug | Sep | Oct | Nov | Dec | |
|---|---|---|---|---|---|---|---|---|---|---|---|---|
| 2021 | -18.0 | -7.4 | ||||||||||
| 2022 | -19.9 | +21.1 | +5.3 | -20.1 | -3.2 | -19.8 | +14.4 | +22.6 | -8.5 | +5.8 | +0.0 | -3.4 |
| 2023 | +29.7 | -16.7 | -18.0 | +1.9 | +4.9 | +7.8 | +2.4 | +9.4 | +17.0 | +2.5 | +12.3 | -1.7 |
| 2024 | +18.3 | -16.8 | +1.6 | -4.3 | +18.6 | -16.0 | -3.9 | -5.1 | +19.6 | +10.5 | +13.5 | -21.4 |
| 2025 | -12.5 | -14.9 | -5.1 | +8.5 | +11.2 | +19.7 | +18.3 | +13.7 | +20.6 | +14.4 | -12.3 | +5.6 |
| 2026 | +30.7 | +10.6 | -19.2 | +4.6 | -7.2 | -10.8 | -8.8 | +17.7 | -19.1 | -13.0 | +2.8 |
Compare stocks
Market cap
$1.98B
-
-
-
Price / Earnings ratio
-47.70
-
-
-
Price / Sales ratio
559.95
-
-
-
Dividend yield
0.00%
-
-
-
Average volume
27,624,419
-
-
-
Earnings per share
$-0.04
-
-
-