Uranium Energy Corp. (UEC) Stock
Key stats
- Market cap
- $3.58B
- Price / Earnings ratio
- -25.9x
- EPS (TTM)
- -$0.28
- Volume
- Loading
- 52-week high
- $20.34
- 52-week low
- $6.12
Source: third-party data provider, as of November 13, 2026
Compare with UEC
Recent news
Why Is Uranium Energy (UEC) Down 11.8% Since Last Earnings Report?
Why Is Uranium Energy (UEC) Down 11.8% Since Last Earnings Report?
UEC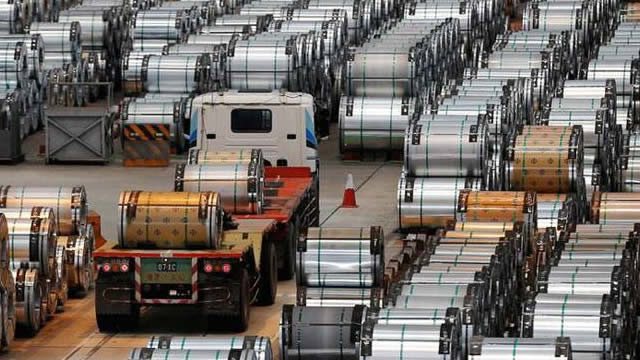
Is It Worth Investing in Uranium Energy (UEC) Based on Wall Street's Bullish Views?
Is It Worth Investing in Uranium Energy (UEC) Based on Wall Street's Bullish Views?
UEC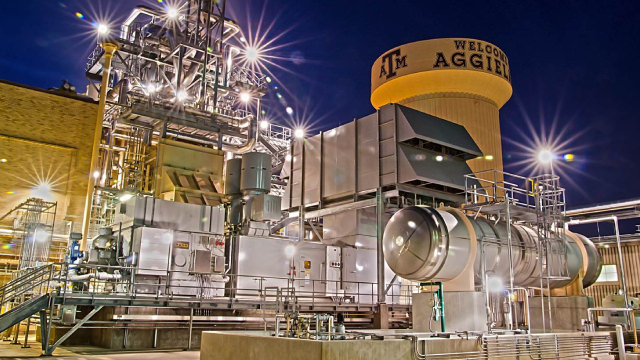
NuScale Power Rises 4% Despite Dilution Concerns; Uranium Energy Advances 4%, Oklo Gains 2%
NuScale Power Rises 4% Despite Dilution Concerns; Uranium Energy Advances 4%, Oklo Gains 2%
UEC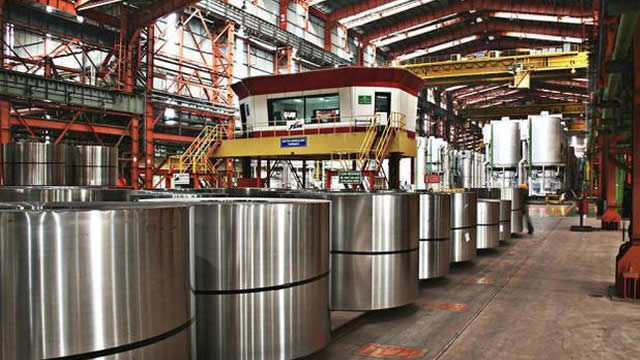
UEC Q4 Earnings Call Highlights Production Ramp and U.S. Strategy
UEC Q4 Earnings Call Highlights Production Ramp and U.S. Strategy
UECNews tone: automated (AI) classification of the article's content, not a price prediction.
Technical indicators
- RSI 14
- 41.37
- MACD 12/26/9
- -0.52
- EMA 9 of MACD
- -0.56
- MACD histogram
- 0.04
- SMA 50
- $9.00
- Price below SMA 50
- EMA 50
- $8.72
- Price below EMA 50
- SMA 200
- $12.07
- Price below SMA 200
- EMA 200
- $11.50
- Price below EMA 200
Calculated by Gotrade from daily closing prices, as of November 11, 2026. Technical data, not a recommendation.
Analyst ratings
Analyst consensus: Hold
Based on 3 analyst ratings
Third-party analyst opinion, not a recommendation from Gotrade.
Financials
Performance
Debt & Balance Sheet
Revenue to Profit
2026Earnings
No data available
Source: third-party data provider
Latest news
Why Is Uranium Energy (UEC) Down 11.8% Since Last Earnings Report?
Why Is Uranium Energy (UEC) Down 11.8% Since Last Earnings Report?
UECIs It Worth Investing in Uranium Energy (UEC) Based on Wall Street's Bullish Views?
Is It Worth Investing in Uranium Energy (UEC) Based on Wall Street's Bullish Views?
UECNuScale Power Rises 4% Despite Dilution Concerns; Uranium Energy Advances 4%, Oklo Gains 2%
NuScale Power Rises 4% Despite Dilution Concerns; Uranium Energy Advances 4%, Oklo Gains 2%
UECUEC Q4 Earnings Call Highlights Production Ramp and U.S. Strategy
UEC Q4 Earnings Call Highlights Production Ramp and U.S. Strategy
UEC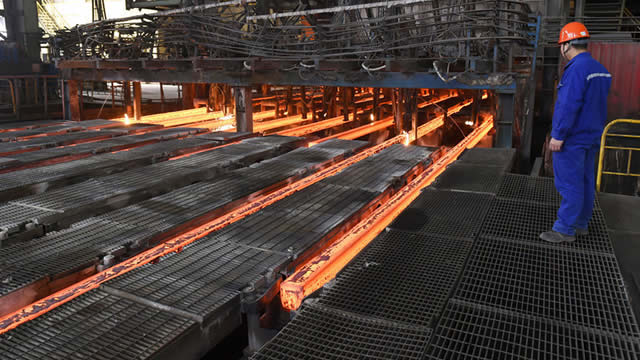
What Uranium Energy (UEC) Said on Its Q4 Earnings Call
What Uranium Energy (UEC) Said on Its Q4 Earnings Call
UEC
Uranium Energy Surges 6% as Multi-Mine Ramp Delivers $93.13 Realized Uranium Price; Oklo and NuScale Power Tick Up
Uranium Energy Surges 6% as Multi-Mine Ramp Delivers $93.13 Realized Uranium Price; Oklo and NuScale Power Tick Up
UEC
Uranium Energy (UEC) Reports Q4 Loss, Beats Revenue Estimates
Uranium Energy (UEC) Reports Q4 Loss, Beats Revenue Estimates
UEC
Nuclear Energy Stocks Rally as Demand for Reliable Clean Power Grows
Nuclear Energy Stocks Rally as Demand for Reliable Clean Power Grows
UEC
Oklo Climbs 5% as Nuclear Names Bounce Back From Last Week's Selloff; NuScale Power Gains 4%, Uranium Energy Rises 3%
Oklo Climbs 5% as Nuclear Names Bounce Back From Last Week's Selloff; NuScale Power Gains 4%, Uranium Energy Rises 3%
UEC
Uranium Energy vs. Cameco: If I Could Only Own 1 Uranium Stock for the Next Decade, I'd Buy This 1
Uranium Energy vs. Cameco: If I Could Only Own 1 Uranium Stock for the Next Decade, I'd Buy This 1
UECNews tone: automated (AI) classification of the article's content, not a price prediction.
About Uranium Energy Corp.
No description available.
Key Executives
| Name | Title | Year Born |
|---|---|---|
| Mr. Amir Adnani | President, CEO & Director | 1978 |
| Ms. Josephine Man | Secretary, Treasurer, CFO & Principal Accounting Officer | 1974 |
| Mr. Scott Eric Melbye | Executive Vice President | 1962 |
| Mr. Brent D. Berg | Senior Vice President of U.S. Operations | 1972 |
| Ms. Donna Lynn Wichers | Senior Vice President of Production Growth | 1954 |
Fundamentals
Valuation
Profitability
Trading
Source: third-party data provider, as of November 13, 2026
Technical indicators
- RSI 14
- 41.37
- MACD 12/26/9
- -0.52
- EMA 9 of MACD
- -0.56
- MACD histogram
- 0.04
- SMA 50
- $9.00
- Price below SMA 50
- EMA 50
- $8.72
- Price below EMA 50
- SMA 200
- $12.07
- Price below SMA 200
- EMA 200
- $11.50
- Price below EMA 200
Calculated by Gotrade from daily closing prices, as of November 11, 2026. Technical data, not a recommendation.
Analyst views
3 analyst ratings
Third-party analyst opinion, not a recommendation from Gotrade.
- Low
- $10.00
- Average
- $16.08
- High
- $26.75
Seasonality
Monthly price change (%)| Jan | Feb | Mar | Apr | May | Jun | Jul | Aug | Sep | Oct | Nov | Dec | |
|---|---|---|---|---|---|---|---|---|---|---|---|---|
| 2021 | -24.0 | -5.6 | ||||||||||
| 2022 | -29.5 | +44.6 | +12.8 | -9.2 | -9.5 | -13.2 | +26.9 | +11.6 | -17.1 | +10.2 | -5.8 | +5.4 |
| 2023 | +7.5 | -10.4 | -22.6 | -12.4 | +4.9 | +17.6 | +5.9 | +20.0 | +17.0 | +22.7 | +12.4 | -2.1 |
| 2024 | +18.6 | -21.0 | -2.7 | -4.5 | +4.4 | -13.4 | +3.0 | -1.9 | +31.6 | +13.3 | +14.0 | -17.4 |
| 2025 | -7.3 | -18.5 | -2.8 | +12.7 | +12.5 | +19.5 | +32.4 | +23.3 | +21.5 | +16.5 | -12.4 | -0.7 |
| 2026 | +31.5 | -6.1 | -13.8 | +10.9 | -7.8 | -21.6 | -9.0 | +22.8 | -18.5 | -17.6 | -3.7 |