Darden Restaurants (DRI) Stock
Key stats
- Market cap
- $24.95B
- Price / Earnings ratio
- 20.7x
- EPS (TTM)
- $10.31
- Volume
- Loading
- 52-week high
- $229.76
- 52-week low
- $169.00
- Dividend yield
- 2.83%
- Dividend amount (latest)
- $1.62
- EPS vs analyst estimate
- -1.5%Q1 FY26 · $1.97 vs $2.00
Source: third-party data provider, as of October 31, 2026
EPS estimate: analyst consensus
Compare with DRI
Recent news
WEN vs. DRI: Which Stock Is the Better Value Option?
WEN vs. DRI: Which Stock Is the Better Value Option?
DRI
Restaurant earnings will test whether owning more brands pays off
Restaurant earnings will test whether owning more brands pays off
DRI
3 Restaurant Stocks That Turn Burgers, Pizza and Pasta Into Dividend Income
3 Restaurant Stocks That Turn Burgers, Pizza and Pasta Into Dividend Income
DRI
FCPT Announces Extensions for 100% of Olive Garden and LongHorn Leases Maturing in 2027
FCPT Announces Extensions for 100% of Olive Garden and LongHorn Leases Maturing in 2027
DRINews tone: automated (AI) classification of the article's content, not a price prediction.
Technical indicators
- RSI 14
- 62.83
- MACD 12/26/9
- 2.85
- EMA 9 of MACD
- 1.71
- MACD histogram
- 1.14
- SMA 50
- $210.52
- Price above SMA 50
- EMA 50
- $209.96
- Price above EMA 50
- SMA 200
- $205.65
- Price above SMA 200
- EMA 200
- $203.30
- Price above EMA 200
Calculated by Gotrade from daily closing prices, as of October 29, 2026. Technical data, not a recommendation.
Analyst ratings
Analyst consensus: Buy
Based on 13 analyst ratings
Third-party analyst opinion, not a recommendation from Gotrade.
Financials
Performance
Debt & Balance Sheet
Revenue to Profit
2026Earnings
The market is expecting earnings per share of $2.11 for this quarter. The company has not yet shared when it is announcing earnings.
Source: third-party data provider
Latest news
WEN vs. DRI: Which Stock Is the Better Value Option?
WEN vs. DRI: Which Stock Is the Better Value Option?
DRIRestaurant earnings will test whether owning more brands pays off
Restaurant earnings will test whether owning more brands pays off
DRI3 Restaurant Stocks That Turn Burgers, Pizza and Pasta Into Dividend Income
3 Restaurant Stocks That Turn Burgers, Pizza and Pasta Into Dividend Income
DRIFCPT Announces Extensions for 100% of Olive Garden and LongHorn Leases Maturing in 2027
FCPT Announces Extensions for 100% of Olive Garden and LongHorn Leases Maturing in 2027
DRI
Darden vs. McDonald's: Which Restaurant Stock Is the Better Buy for Income Investors
Darden vs. McDonald's: Which Restaurant Stock Is the Better Buy for Income Investors
DRI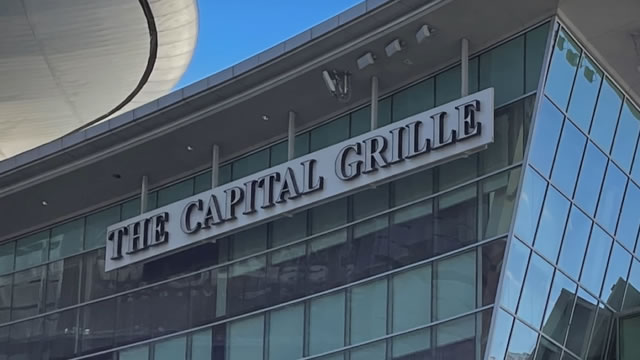
Darden Restaurants Serves Up Fresh Catalysts for a Stock Price Rally
Darden Restaurants Serves Up Fresh Catalysts for a Stock Price Rally
DRI
Darden Q1 Earnings & Revenues Miss Estimates, Both Up Y/Y, Stock Down
Darden Q1 Earnings & Revenues Miss Estimates, Both Up Y/Y, Stock Down
DRI
Darden Restaurants Q1 Earnings Call Highlights
Darden Restaurants Q1 Earnings Call Highlights
DRI
Compared to Estimates, Darden Restaurants (DRI) Q1 Earnings: A Look at Key Metrics
Compared to Estimates, Darden Restaurants (DRI) Q1 Earnings: A Look at Key Metrics
DRI
Thursday's First Moves: DRI Earnings, Diller's Withdraws MGM Bid, P All-Time High
Thursday's First Moves: DRI Earnings, Diller's Withdraws MGM Bid, P All-Time High
DRINews tone: automated (AI) classification of the article's content, not a price prediction.
About Darden Restaurants
Darden Restaurants, Inc. operates full service restaurants in the United States and Canada. It operates restaurants under the Red Lobster, Olive Garden, LongHorn Steakhouse, The Capital Grille, Bahama Breeze, and Seasons 52 brand names.
Key Executives
| Name | Title | Year Born |
|---|---|---|
| Mr. Ricardo Cardenas CPA | CEO, President & Director | 1968 |
| Mr. Rajesh Vennam | Senior VP & CFO | 1974 |
| Ms. Sarah H. King | Senior VP & Chief People Officer | 1970 |
| Mr. Todd A. Burrowes | President of Business Development | 1963 |
| Mr. John Melvin Martin | President of Specialty Restaurant Group | 1961 |
| Mr. Christopher Chang | Senior VP & Chief Information Officer | — |
| Ms. Courtney Aquilla | Vice President of Finance & Investor Relations | — |
| Ms. Lindsay L. Koren | Senior VP, General Counsel, Chief Compliance Officer & Corporate Secretary | 1978 |
| Ms. Susan M. Connelly | Senior VP and Chief Communications & Public Affairs Officer | 1971 |
| Mr. Douglas J. Milanes | Senior VP & Chief Supply Chain Officer | 1963 |
Fundamentals
Valuation
Profitability
Trading
Dividend
Source: third-party data provider, as of October 31, 2026
Technical indicators
- RSI 14
- 62.83
- MACD 12/26/9
- 2.85
- EMA 9 of MACD
- 1.71
- MACD histogram
- 1.14
- SMA 50
- $210.52
- Price above SMA 50
- EMA 50
- $209.96
- Price above EMA 50
- SMA 200
- $205.65
- Price above SMA 200
- EMA 200
- $203.30
- Price above EMA 200
Calculated by Gotrade from daily closing prices, as of October 29, 2026. Technical data, not a recommendation.
Analyst views
13 analyst ratings
Third-party analyst opinion, not a recommendation from Gotrade.
- Low
- $215.00
- Average
- $238.77
- High
- $260.00
Seasonality
Monthly price change (%)| Jan | Feb | Mar | Apr | May | Jun | Jul | Aug | Sep | Oct | Nov | Dec | |
|---|---|---|---|---|---|---|---|---|---|---|---|---|
| 2021 | -6.8 | +10.2 | ||||||||||
| 2022 | -6.0 | +3.8 | -5.0 | +1.3 | -5.9 | -8.7 | +8.9 | -0.8 | +0.3 | +14.1 | +2.8 | -5.0 |
| 2023 | +5.7 | -2.8 | +8.0 | -1.3 | +4.8 | +3.3 | +0.9 | -6.5 | -7.9 | +2.2 | +7.4 | +2.7 |
| 2024 | +0.2 | +2.1 | -2.4 | -8.3 | -0.5 | +0.1 | -1.4 | +8.8 | +3.7 | -2.5 | +10.4 | +8.5 |
| 2025 | +4.7 | +0.9 | +6.0 | -4.2 | +7.2 | +0.5 | -8.2 | +1.7 | -8.5 | -6.4 | +1.1 | +5.8 |
| 2026 | +6.5 | +6.4 | -6.6 | +3.9 | +4.7 | +2.0 | +0.8 | +3.9 | -10.3 | +11.7 |