
Equinix (EQIX) Stock
Key stats
- Market cap
- $100.41B
- Price / Earnings ratio
- 60.9x
- EPS (TTM)
- $16.72
- Volume
- Loading
- 52-week high
- $1128.68
- 52-week low
- $720.62
- Dividend yield
- 1.91%
- Dividend amount (latest)
- $5.16
- EPS vs analyst estimate
- +84.1%Q3 FY25 · $9.83 vs $5.34
Source: third-party data provider, as of November 5, 2026
EPS estimate: analyst consensus
Compare with EQIX
Recent news

Unlocking Equinix (EQIX) International Revenues: Trends, Surprises, and Prospects
Unlocking Equinix (EQIX) International Revenues: Trends, Surprises, and Prospects
EQIX
Equinix Q3 AFFO Beat Estimates on Record Bookings, Strong Pricing
Equinix Q3 AFFO Beat Estimates on Record Bookings, Strong Pricing
EQIX
What Equinix (EQIX) Said on Its Q3 Earnings Call
What Equinix (EQIX) Said on Its Q3 Earnings Call
EQIX
Equinix (EQIX) Q3 Earnings: Taking a Look at Key Metrics Versus Estimates
Equinix (EQIX) Q3 Earnings: Taking a Look at Key Metrics Versus Estimates
EQIXNews tone: automated (AI) classification of the article's content, not a price prediction.
Technical indicators
- RSI 14
- 59.53
- MACD 12/26/9
- 0.18
- EMA 9 of MACD
- -6.94
- MACD histogram
- 7.13
- SMA 50
- $1,019.63
- Price above SMA 50
- EMA 50
- $1,017.71
- Price above EMA 50
- SMA 200
- $1,014.11
- Price above SMA 200
- EMA 200
- $977.44
- Price above EMA 200
Calculated by Gotrade from daily closing prices, as of November 4, 2026. Technical data, not a recommendation.
Analyst ratings
Analyst consensus: Buy
Based on 10 analyst ratings
Third-party analyst opinion, not a recommendation from Gotrade.
Financials
Performance
Debt & Balance Sheet
Revenue to Profit
2025Earnings
The market is expecting earnings per share of $9.10 for this quarter. The company has not yet shared when it is announcing earnings.
Source: third-party data provider
Latest news
Unlocking Equinix (EQIX) International Revenues: Trends, Surprises, and Prospects
Unlocking Equinix (EQIX) International Revenues: Trends, Surprises, and Prospects
EQIXEquinix Q3 AFFO Beat Estimates on Record Bookings, Strong Pricing
Equinix Q3 AFFO Beat Estimates on Record Bookings, Strong Pricing
EQIXWhat Equinix (EQIX) Said on Its Q3 Earnings Call
What Equinix (EQIX) Said on Its Q3 Earnings Call
EQIXEquinix (EQIX) Q3 Earnings: Taking a Look at Key Metrics Versus Estimates
Equinix (EQIX) Q3 Earnings: Taking a Look at Key Metrics Versus Estimates
EQIX
Equinix (EQIX) Surpasses Q3 FFO and Revenue Estimates
Equinix (EQIX) Surpasses Q3 FFO and Revenue Estimates
EQIX
What Equinix, KLA, and Vertiv Earnings Could Signal About Data Center Demand
What Equinix, KLA, and Vertiv Earnings Could Signal About Data Center Demand
EQIX
Equinix to Post Q3 Earnings: What's in Store for the Stock?
Equinix to Post Q3 Earnings: What's in Store for the Stock?
EQIX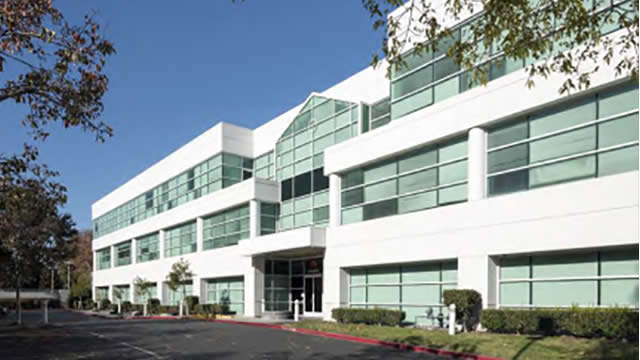
4 Data Center REITs With Growing Dividends and an AI Tailwind
4 Data Center REITs With Growing Dividends and an AI Tailwind
EQIX
Why AI data centers are powering a boom in fuel-cell demand
Why AI data centers are powering a boom in fuel-cell demand
EQIX
Seeking Clues to Equinix (EQIX) Q3 Earnings? A Peek Into Wall Street Projections for Key Metrics
Seeking Clues to Equinix (EQIX) Q3 Earnings? A Peek Into Wall Street Projections for Key Metrics
EQIXNews tone: automated (AI) classification of the article's content, not a price prediction.
About Equinix
Equinix, Inc. is an American multinational company headquartered in Redwood City, California, that specializes in Internet connection and data centers. The company is a leader in global co-location data center market share. At Equinix, we believe digital infrastructure is your greatest source of competitive advantage. Digital leaders need one place to bring together and interconnect the foundational infrastructure to power their success.
Key Executives
| Name | Title | Year Born |
|---|---|---|
| Ms. Adaire Rita Fox-Martin | President, CEO & Director | 1964 |
| Mr. Charles John Meyers | Executive Chairman | 1966 |
| Mr. Olivier C. Leonetti | Chief Financial Officer | 1965 |
| Mr. Raouf F. Abdel | Executive Vice President of Global Operations | 1968 |
| Mr. Keith D. Taylor | Special Advisor | 1962 |
| Mr. Michael Shane Paladin | Executive VP & Chief Customer and Revenue Officer | 1978 |
| Mr. Ryan C. Burke | Vice President of Investor Relations | — |
| Mr. Kurt Pletcher | Chief Legal Officer | 1971 |
| Mr. DD Dasgupta | Chief Marketing Officer | — |
| Ms. Brandi Galvin Morandi J.D. | Chief People Officer | 1973 |
Fundamentals
Valuation
Profitability
Trading
Dividend
Source: third-party data provider, as of November 5, 2026
Technical indicators
- RSI 14
- 59.53
- MACD 12/26/9
- 0.18
- EMA 9 of MACD
- -6.94
- MACD histogram
- 7.13
- SMA 50
- $1,019.63
- Price above SMA 50
- EMA 50
- $1,017.71
- Price above EMA 50
- SMA 200
- $1,014.11
- Price above SMA 200
- EMA 200
- $977.44
- Price above EMA 200
Calculated by Gotrade from daily closing prices, as of November 4, 2026. Technical data, not a recommendation.
Analyst views
10 analyst ratings
Third-party analyst opinion, not a recommendation from Gotrade.
- Low
- $1,135.00
- Average
- $1,243.20
- High
- $1,350.00
Seasonality
Monthly price change (%)| Jan | Feb | Mar | Apr | May | Jun | Jul | Aug | Sep | Oct | Nov | Dec | |
|---|---|---|---|---|---|---|---|---|---|---|---|---|
| 2021 | +3.2 | +5.3 | ||||||||||
| 2022 | -13.3 | -0.8 | +4.3 | -5.8 | -2.2 | -3.2 | +4.6 | -5.3 | -12.9 | -2.2 | +24.6 | -6.2 |
| 2023 | +11.4 | -6.8 | +6.7 | +2.0 | +3.3 | +4.1 | +3.4 | -3.0 | -6.6 | +2.4 | +10.3 | -2.3 |
| 2024 | +2.4 | +5.0 | -8.4 | -11.1 | +9.7 | +0.7 | +4.0 | +2.9 | +6.7 | +2.8 | +10.5 | -2.3 |
| 2025 | -3.2 | -1.1 | -10.5 | +5.4 | +3.1 | -10.7 | -1.3 | +1.9 | +1.5 | +9.3 | -9.5 | +4.5 |
| 2026 | +7.4 | +20.2 | +1.5 | +8.7 | -1.6 | -0.8 | +0.6 | +1.5 | -1.6 | +0.1 | +2.1 |










