Farmland Partners Inc. (FPI) Stock
Key stats
- Market cap
- $369.41M
- Price / Earnings ratio
- 41.9x
- EPS (TTM)
- $0.19
- Volume
- Loading
- 52-week high
- $13.23
- 52-week low
- $8.28
- Dividend yield
- 6.02%
- Dividend amount (latest)
- $0.09
Source: third-party data provider, as of November 11, 2026
Compare with FPI
Recent news
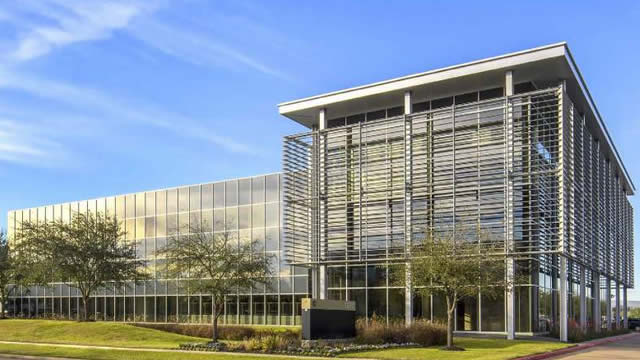
What Farmland Partners (FPI) Said on Its Q3 Earnings Call
What Farmland Partners (FPI) Said on Its Q3 Earnings Call
FPI
Farmland Partners (FPI) Reports Q3 Loss, Misses Revenue Estimates
Farmland Partners (FPI) Reports Q3 Loss, Misses Revenue Estimates
FPI
Farmland Partners Inc. Reports Third Quarter 2026 Results
Farmland Partners Inc. Reports Third Quarter 2026 Results
FPI
Forget Apartments and Offices: These 4 REITs Own Casinos, Forests and Farms
Forget Apartments and Offices: These 4 REITs Own Casinos, Forests and Farms
FPINews tone: automated (AI) classification of the article's content, not a price prediction.
Technical indicators
- RSI 14
- 33.65
- MACD 12/26/9
- -0.48
- EMA 9 of MACD
- -0.42
- MACD histogram
- -0.06
- SMA 50
- $10.29
- Price below SMA 50
- EMA 50
- $9.92
- Price below EMA 50
- SMA 200
- $10.65
- Price below SMA 200
- EMA 200
- $10.43
- Price below EMA 200
Calculated by Gotrade from daily closing prices, as of November 10, 2026. Technical data, not a recommendation.
Analyst ratings
No analyst data available
Financials
Performance
Debt & Balance Sheet
Revenue to Profit
2025Earnings
The market is expecting earnings per share of $0.05 for this quarter. The company has not yet shared when it is announcing earnings.
Source: third-party data provider
Latest news
What Farmland Partners (FPI) Said on Its Q3 Earnings Call
What Farmland Partners (FPI) Said on Its Q3 Earnings Call
FPIFarmland Partners (FPI) Reports Q3 Loss, Misses Revenue Estimates
Farmland Partners (FPI) Reports Q3 Loss, Misses Revenue Estimates
FPIFarmland Partners Inc. Reports Third Quarter 2026 Results
Farmland Partners Inc. Reports Third Quarter 2026 Results
FPIForget Apartments and Offices: These 4 REITs Own Casinos, Forests and Farms
Forget Apartments and Offices: These 4 REITs Own Casinos, Forests and Farms
FPI
Farmland Partners Inc. Announces Date for Third Quarter 2026 Earnings Release and Conference Call
Farmland Partners Inc. Announces Date for Third Quarter 2026 Earnings Release and Conference Call
FPI
Farmland Partners Q2 Earnings Call Highlights
Farmland Partners Q2 Earnings Call Highlights
FPI
Farmland Partners (FPI) Beats Q2 FFO and Revenue Estimates
Farmland Partners (FPI) Beats Q2 FFO and Revenue Estimates
FPI
Farmland Partners Inc. Reports Second Quarter 2026 Results
Farmland Partners Inc. Reports Second Quarter 2026 Results
FPI
Farmland Partners Inc. Announces Date for Second Quarter 2026 Earnings Release and Conference Call
Farmland Partners Inc. Announces Date for Second Quarter 2026 Earnings Release and Conference Call
FPI
Farmland Partners (FPI) Q1 FFO and Revenues Beat Estimates
Farmland Partners (FPI) Q1 FFO and Revenues Beat Estimates
FPINews tone: automated (AI) classification of the article's content, not a price prediction.
About Farmland Partners Inc.
Farmland Partners Inc owns and seeks to acquire high-quality farmland throughout North America. The company is an internally managed real estate company which owns and contracts farmland and storage facilities located across the United States. Majority of the properties in its portfolio are used to grow primary crops, such as corn, soybeans, wheat, rice and cotton, and rest to produce specialty crops, such as almonds, pictachios, citrus, avacados, strawberies, and edible beans. The company generates its revenues through the rent it receives from its tenants.
Key Executives
| Name | Title | Year Born |
|---|---|---|
| Mr. Luca Fabbri | President, CEO & Board Director | 1969 |
| Mr. Paul A. Pittman J.D. | Executive Chairman | 1962 |
| Ms. Susan M. Landi | CFO & Treasurer | 1977 |
| Ms. Christine M. Garrison J.D. | General Counsel & Corporate Secretary | 1979 |
| Mr. Richard Keck | Vice President of Operations | — |
Fundamentals
Valuation
Profitability
Trading
Dividend
Source: third-party data provider, as of November 11, 2026
Technical indicators
- RSI 14
- 33.65
- MACD 12/26/9
- -0.48
- EMA 9 of MACD
- -0.42
- MACD histogram
- -0.06
- SMA 50
- $10.29
- Price below SMA 50
- EMA 50
- $9.92
- Price below EMA 50
- SMA 200
- $10.65
- Price below SMA 200
- EMA 200
- $10.43
- Price below EMA 200
Calculated by Gotrade from daily closing prices, as of November 10, 2026. Technical data, not a recommendation.
Analyst views
No analyst data available
Seasonality
Monthly price change (%)| Jan | Feb | Mar | Apr | May | Jun | Jul | Aug | Sep | Oct | Nov | Dec | |
|---|---|---|---|---|---|---|---|---|---|---|---|---|
| 2021 | -7.8 | +3.8 | ||||||||||
| 2022 | -6.6 | +1.4 | +18.0 | +5.0 | +3.4 | -7.8 | +8.0 | -2.9 | -11.0 | +11.1 | -5.6 | -6.2 |
| 2023 | +3.5 | -17.0 | +0.4 | -0.8 | +9.2 | +6.2 | -6.7 | -2.6 | -8.2 | +0.8 | +16.9 | -1.0 |
| 2024 | -8.6 | +4.7 | -3.4 | -0.9 | -2.4 | +5.8 | -5.7 | -0.4 | +2.7 | +15.1 | +9.6 | -6.7 |
| 2025 | -0.8 | +1.2 | -4.2 | -9.7 | +12.4 | +0.4 | -8.6 | +3.9 | +2.0 | -7.3 | -2.8 | -0.3 |
| 2026 | +20.1 | +15.7 | -13.9 | -4.4 | -4.1 | -6.0 | -3.2 | +7.5 | +7.6 | -26.6 | +2.6 |