Ero Copper Corp. (ERO) Stock
NYSE · ERO
Key stats
- Market cap
- $3.22B
- Price / Earnings ratio
- 8.1x
- EPS (TTM)
- $3.75
- Volume
- Loading
- 52-week high
- $40.83
- 52-week low
- $19.09
Source: third-party data provider, as of November 5, 2026
Compare with ERO
Recent news
MarketBeat
Ero Copper Q3 Earnings Call Highlights
PositiveERONovember 4, 2026
MarketBeatPositive
Ero Copper Q3 Earnings Call Highlights
ERO
The Motley Fool
Ero Copper's 2027 Outlook: Leverage Down From 2.6x to 0.8x With a 24-Year Growth Project Waiting in the Wings
PositiveEROOctober 25, 2026
The Motley FoolPositive
Ero Copper's 2027 Outlook: Leverage Down From 2.6x to 0.8x With a 24-Year Growth Project Waiting in the Wings
ERO
InvestorPlace
The AI Boom Has a Copper Problem, and Here's One Stock the Smart Money Is Betting On
NeutralEROOctober 11, 2026
InvestorPlaceNeutral
The AI Boom Has a Copper Problem, and Here's One Stock the Smart Money Is Betting On
ERO
MarketBeat
3 Sectors Where Volatility Is Creating Entry Points, Not Exit Signals
NeutralEROOctober 6, 2026
MarketBeatNeutral
3 Sectors Where Volatility Is Creating Entry Points, Not Exit Signals
ERONews tone: automated (AI) classification of the article's content, not a price prediction.
Technical indicators
- RSI 14
- 41.71
- MACD 12/26/9
- -1.48
- EMA 9 of MACD
- -1.25
- MACD histogram
- -0.23
- SMA 50
- $34.92
- Price below SMA 50
- EMA 50
- $33.40
- Price below EMA 50
- SMA 200
- $30.64
- Price above SMA 200
- EMA 200
- $30.84
- Price below EMA 200
Calculated by Gotrade from daily closing prices, as of November 4, 2026. Technical data, not a recommendation.
Analyst ratings
No analyst data available
Financials
Performance
Revenue
Net income
Net margin %
2025
943M622M311M0
Debt & Balance Sheet
Total assets
Total liabilities
2025
2B2B762M0
Revenue to Profit
2025$785.8M
Revenue$0.0
Cost of revenue$344.6M
Gross profit$0.0
Operating expenses$263.7M
Net incomeEarnings
No data available
Source: third-party data provider
Latest news
MarketBeat
Ero Copper Q3 Earnings Call Highlights
PositiveERONovember 4, 2026
MarketBeatPositive
Ero Copper Q3 Earnings Call Highlights
EROThe Motley Fool
Ero Copper's 2027 Outlook: Leverage Down From 2.6x to 0.8x With a 24-Year Growth Project Waiting in the Wings
PositiveEROOctober 25, 2026
The Motley FoolPositive
Ero Copper's 2027 Outlook: Leverage Down From 2.6x to 0.8x With a 24-Year Growth Project Waiting in the Wings
EROInvestorPlace
The AI Boom Has a Copper Problem, and Here's One Stock the Smart Money Is Betting On
NeutralEROOctober 11, 2026
InvestorPlaceNeutral
The AI Boom Has a Copper Problem, and Here's One Stock the Smart Money Is Betting On
EROMarketBeat
3 Sectors Where Volatility Is Creating Entry Points, Not Exit Signals
NeutralEROOctober 6, 2026
MarketBeatNeutral
3 Sectors Where Volatility Is Creating Entry Points, Not Exit Signals
ERO
Stocktwits
'Big Short' Michael Burry Tunes Out AI ‘Woo-Hoos’ — Finds Opportunity In Copper, QXO And 3 More Stocks
EROSeptember 22, 2026
Stocktwits
'Big Short' Michael Burry Tunes Out AI ‘Woo-Hoos’ — Finds Opportunity In Copper, QXO And 3 More Stocks
ERO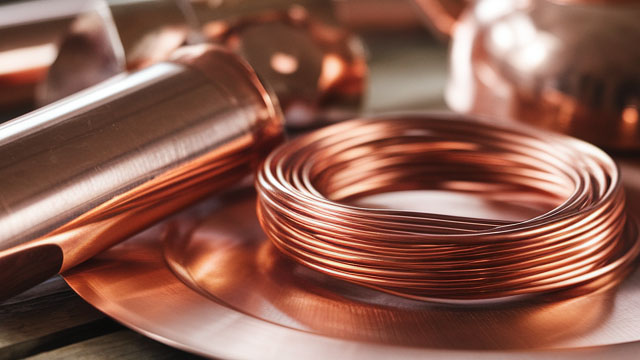
24/7 Wall Street
Everyone Is Watching $100 Oil While Copper Miners Are Getting Crushed
NegativeEROSeptember 10, 2026
24/7 Wall StreetNegative
Everyone Is Watching $100 Oil While Copper Miners Are Getting Crushed
ERO
MarketBeat
Ero Copper Q2 Earnings Call Highlights
EROAugust 8, 2026
MarketBeat
Ero Copper Q2 Earnings Call Highlights
ERO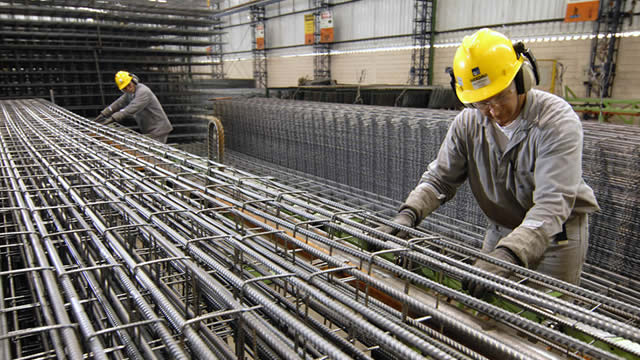
Zacks Investment Research
Zacks Industry Outlook Southern Copper, Freeport, Lundin, Energy and Ero
EROAugust 6, 2026
Zacks Investment Research
Zacks Industry Outlook Southern Copper, Freeport, Lundin, Energy and Ero
ERO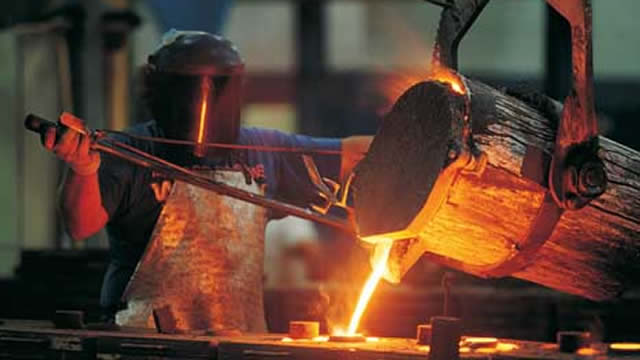
Zacks Investment Research
5 Non-Ferrous Metal Mining Stocks to Watch in a Challenging Industry
EROAugust 5, 2026
Zacks Investment Research
5 Non-Ferrous Metal Mining Stocks to Watch in a Challenging Industry
ERO
24/7 Wall Street
Copper's Biggest Intraday Drop in 2026: 5 Stocks Most at Risk Today
EROJuly 22, 2026
24/7 Wall Street
Copper's Biggest Intraday Drop in 2026: 5 Stocks Most at Risk Today
ERONews tone: automated (AI) classification of the article's content, not a price prediction.
About Ero Copper Corp.
No description available.
SectorBasic Materials
IndustryCopper
Employees3,690
CEOMr. Makko DeFilippo
IPO DateDec 27, 2007
HeadquartersVancouver, BC
Key Executives
| Name | Title | Year Born |
|---|---|---|
| Mr. Makko DeFilippo | President, CEO & Director | 1987 |
| Mr. David Maxwell Strang | Co-Founder & Executive Chairman | 1968 |
| Mr. Wayne Drier | Executive VP & CFO | — |
| Mr. Gelson da Silva Batista | Executive VP & COO | — |
| Ms. Courtney R. B. Lynn | Executive Vice President, External Affairs and Strategy | 1981 |
| Mr. Farooq Hamed | Vice President of Investor Relations | — |
| Mr. Deepk Hundal | Executive VP, Corporate Secretary & General Counsel | — |
| Mr. Brett Ronald Hannigan | Vice President of Corporate Development | — |
| Mr. Eduardo de Come | Executive Vice President of Brazil | 1966 |
Fundamentals
Valuation
Price-to-sales ratio2.61
Price-to-book value2.38
Profitability
Return on Equity34.00%
Return on Assets19.00%
Return on Sales43.00%
Gross margin (latest quarter)42.71%
EBITDA$683.22M
Trading
Average volume1,357,764
Source: third-party data provider, as of November 5, 2026
Technical indicators
- RSI 14
- 41.71
- MACD 12/26/9
- -1.48
- EMA 9 of MACD
- -1.25
- MACD histogram
- -0.23
- SMA 50
- $34.92
- Price below SMA 50
- EMA 50
- $33.40
- Price below EMA 50
- SMA 200
- $30.64
- Price above SMA 200
- EMA 200
- $30.84
- Price below EMA 200
Calculated by Gotrade from daily closing prices, as of November 4, 2026. Technical data, not a recommendation.
Analyst views
No analyst data available
Seasonality
Monthly price change (%)| Jan | Feb | Mar | Apr | May | Jun | Jul | Aug | Sep | Oct | Nov | Dec | |
|---|---|---|---|---|---|---|---|---|---|---|---|---|
| 2021 | -13.1 | -1.5 | ||||||||||
| 2022 | -17.5 | +14.4 | +2.6 | -7.5 | -8.9 | -30.2 | +17.0 | -7.2 | +21.5 | +1.1 | +3.0 | +4.5 |
| 2023 | +18.9 | -6.7 | +6.4 | +8.7 | -17.6 | +18.9 | +15.2 | -11.9 | -15.3 | -16.5 | -7.2 | +15.7 |
| 2024 | -0.6 | +4.1 | +8.7 | +5.8 | +4.2 | +3.9 | -8.5 | +9.9 | +15.8 | -18.5 | -17.6 | -11.5 |
| 2025 | -2.5 | -11.2 | +6.4 | +1.3 | +12.4 | +16.0 | -20.7 | +6.9 | +36.6 | +3.4 | +23.1 | +10.4 |
| 2026 | +15.4 | -0.0 | -20.1 | -7.8 | +20.7 | -14.9 | +4.6 | +35.7 | +5.4 | -18.7 | +5.7 |
Compare stocks
Market cap
$3.22B
-
-
-
Price / Earnings ratio
8.10
-
-
-
Price / Sales ratio
2.61
-
-
-
Dividend yield
0.00%
-
-
-
Average volume
1,357,764
-
-
-
Earnings per share
$3.75
-
-
-