Freeport-McMoRan (FCX) Stock
Key stats
- Market cap
- $89.89B
- Price / Earnings ratio
- 30.1x
- EPS (TTM)
- $2.03
- Volume
- Loading
- 52-week high
- $80.24
- 52-week low
- $38.54
- Dividend yield
- 0.96%
- Dividend amount (latest)
- $0.15
- EPS vs analyst estimate
- +22.0%Q3 FY25 · $0.50 vs $0.41
Source: third-party data provider, as of November 5, 2026
EPS estimate: analyst consensus
Compare with FCX
Recent news

Copper Is Priced Like an AI Stock Now. What the Sell-off Means for Freeport-McMoRan.
Copper Is Priced Like an AI Stock Now. What the Sell-off Means for Freeport-McMoRan.
FCX
5 Non-Ferrous Metal Mining Stocks to Watch in a Challenging Industry
5 Non-Ferrous Metal Mining Stocks to Watch in a Challenging Industry
FCX
FCX Q3 Earnings Call Highlights Grasberg Recovery and Growth Plans
FCX Q3 Earnings Call Highlights Grasberg Recovery and Growth Plans
FCX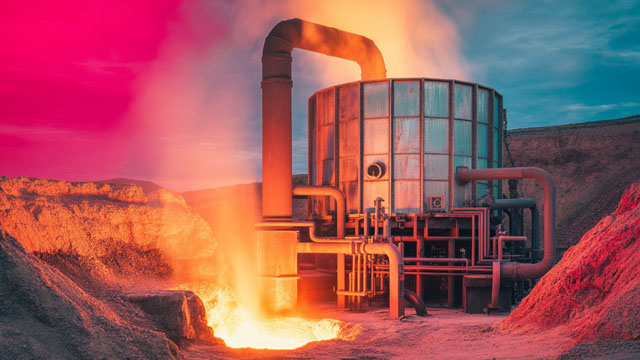
What Freeport-McMoRan (FCX) Said on Its Q3 Earnings Call
What Freeport-McMoRan (FCX) Said on Its Q3 Earnings Call
FCXNews tone: automated (AI) classification of the article's content, not a price prediction.
Technical indicators
- RSI 14
- 33.65
- MACD 12/26/9
- -2.27
- EMA 9 of MACD
- -1.72
- MACD histogram
- -0.55
- SMA 50
- $70.64
- Price below SMA 50
- EMA 50
- $68.45
- Price below EMA 50
- SMA 200
- $65.25
- Price below SMA 200
- EMA 200
- $63.72
- Price below EMA 200
Calculated by Gotrade from daily closing prices, as of November 4, 2026. Technical data, not a recommendation.
Analyst ratings
Analyst consensus: Buy
Based on 10 analyst ratings
Third-party analyst opinion, not a recommendation from Gotrade.
Financials
Performance
Debt & Balance Sheet
Revenue to Profit
2025Earnings
The market is expecting earnings per share of $0.57 for this quarter. The company has not yet shared when it is announcing earnings.
Source: third-party data provider
Latest news
Copper Is Priced Like an AI Stock Now. What the Sell-off Means for Freeport-McMoRan.
Copper Is Priced Like an AI Stock Now. What the Sell-off Means for Freeport-McMoRan.
FCX5 Non-Ferrous Metal Mining Stocks to Watch in a Challenging Industry
5 Non-Ferrous Metal Mining Stocks to Watch in a Challenging Industry
FCXFCX Q3 Earnings Call Highlights Grasberg Recovery and Growth Plans
FCX Q3 Earnings Call Highlights Grasberg Recovery and Growth Plans
FCXWhat Freeport-McMoRan (FCX) Said on Its Q3 Earnings Call
What Freeport-McMoRan (FCX) Said on Its Q3 Earnings Call
FCX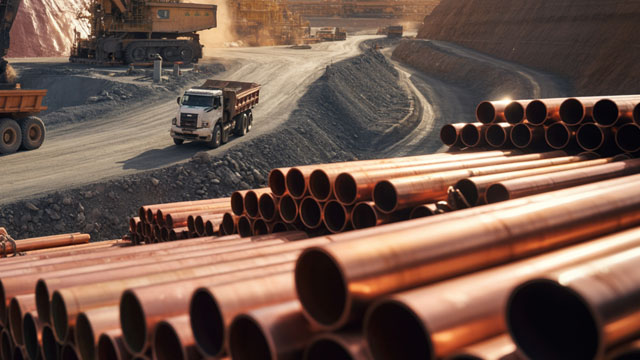
FCX Q3 Earnings Beat Estimates on Strong Copper Pricing
FCX Q3 Earnings Beat Estimates on Strong Copper Pricing
FCX
Compared to Estimates, Freeport-McMoRan (FCX) Q3 Earnings: A Look at Key Metrics
Compared to Estimates, Freeport-McMoRan (FCX) Q3 Earnings: A Look at Key Metrics
FCX
Freeport-McMoRan (FCX) Q3 Earnings and Revenues Surpass Estimates
Freeport-McMoRan (FCX) Q3 Earnings and Revenues Surpass Estimates
FCX
Freeport beats Q3 earnings expectations despite rising costs and sharp drop in gold sales
Freeport beats Q3 earnings expectations despite rising costs and sharp drop in gold sales
FCX
Freeport Third-Quarter and Nine-Month 2026 Financial and Operating Results Release Available on Its Website
Freeport Third-Quarter and Nine-Month 2026 Financial and Operating Results Release Available on Its Website
FCX
Why Investors Need to Take Advantage of These 2 Basic Materials Stocks Now
Why Investors Need to Take Advantage of These 2 Basic Materials Stocks Now
FCXNews tone: automated (AI) classification of the article's content, not a price prediction.
About Freeport-McMoRan
Freeport-McMoRan is a leading international mining company with headquarters in Phoenix, Arizona. We operate large, long-lived geographically diverse assets with significant proven and probable reserves of copper, gold and molybdenum. Our portfolio of assets includes the Grasberg minerals district in Indonesia, one of the world’s largest copper and gold deposits; and significant mining operations in the Americas, including the large-scale Morenci minerals district in North America and the Cerro Verde operation in South America.
Key Executives
| Name | Title | Year Born |
|---|---|---|
| Ms. Kathleen Lynne Quirk | CEO, President & Director | 1964 |
| Ms. Maree E. Robertson | Executive VP & CFO | 1976 |
| Mr. A. Cory Stevens | Senior Vice President and President & COO of Freeport McMoRan Mining Services | — |
| Mr. Stephen T. Higgins | Executive VP & Chief Administrative Officer | 1958 |
| Mr. Douglas N. Currault II | Executive VP & General Counsel | 1965 |
| Ms. Ellie L. Mikes | VP & Chief Accounting Officer | 1978 |
| Mr. Bertrand L. Odinet II | Senior VP, Chief Information Officer & Chief Innovation Officer | — |
| Mr. David Joint | Vice President of Investor Relations | — |
| Ms. Pamela Q. Masson | Senior VP & Chief Human Resources Officer, | — |
| Mr. W. Russell King | Senior Vice President of International Relations & Federal Government Affairs | 1950 |
Fundamentals
Valuation
Profitability
Trading
Dividend
Source: third-party data provider, as of November 5, 2026
Technical indicators
- RSI 14
- 33.65
- MACD 12/26/9
- -2.27
- EMA 9 of MACD
- -1.72
- MACD histogram
- -0.55
- SMA 50
- $70.64
- Price below SMA 50
- EMA 50
- $68.45
- Price below EMA 50
- SMA 200
- $65.25
- Price below SMA 200
- EMA 200
- $63.72
- Price below EMA 200
Calculated by Gotrade from daily closing prices, as of November 4, 2026. Technical data, not a recommendation.
Analyst views
10 analyst ratings
Third-party analyst opinion, not a recommendation from Gotrade.
- Low
- $47.00
- Average
- $77.50
- High
- $90.00
Seasonality
Monthly price change (%)| Jan | Feb | Mar | Apr | May | Jun | Jul | Aug | Sep | Oct | Nov | Dec | |
|---|---|---|---|---|---|---|---|---|---|---|---|---|
| 2021 | -6.0 | +15.2 | ||||||||||
| 2022 | -10.3 | +20.3 | +3.8 | -20.4 | -2.7 | -26.2 | +8.0 | -1.3 | -2.7 | +8.0 | +21.0 | -4.0 |
| 2023 | +17.7 | -8.6 | -4.9 | -8.0 | -8.7 | +12.8 | +9.5 | -8.8 | -10.1 | -7.8 | +10.7 | +8.5 |
| 2024 | -5.7 | -5.9 | +24.0 | +5.5 | +5.7 | -6.6 | -6.2 | +1.5 | +20.7 | -10.6 | -3.0 | -12.7 |
| 2025 | -5.4 | +2.9 | +6.6 | -5.5 | +5.7 | +8.0 | -8.6 | +10.9 | -12.7 | +6.7 | +4.4 | +17.9 |
| 2026 | +16.0 | +12.0 | -13.9 | -5.6 | +16.2 | -6.2 | +3.5 | +19.0 | -3.4 | -9.8 | -0.6 |
Corporate actions
Upcoming
No upcoming corporate actions for FCX