FLEX LNG Ltd. Ordinary Shares (FLNG) Stock
Key stats
- Market cap
- $1.37B
- Price / Earnings ratio
- 13.3x
- EPS (TTM)
- $1.90
- Volume
- Loading
- 52-week high
- $33.40
- 52-week low
- $24.14
- Dividend yield
- 11.85%
- Dividend amount (latest)
- $0.75
Source: third-party data provider, as of November 13, 2026
Compare with FLNG
Recent news
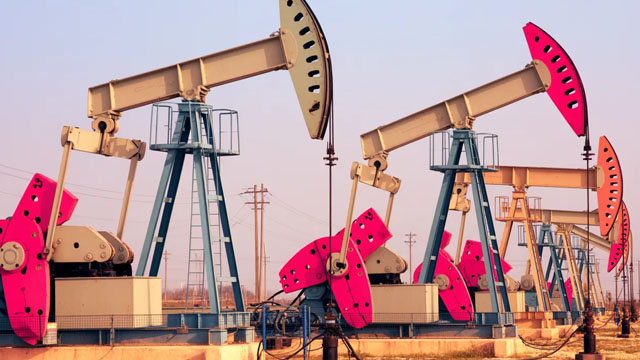
Eni Advances Coral North, Evaluates Third Mozambique LNG Facility
Eni Advances Coral North, Evaluates Third Mozambique LNG Facility
FLNG
These Shipping Stocks Yield Up to 9%. The Dividends Come With a Catch
These Shipping Stocks Yield Up to 9%. The Dividends Come With a Catch
FLNG
Flex LNG Q2 Earnings Call Highlights
Flex LNG Q2 Earnings Call Highlights
FLNG
FLEX LNG vs. Targa Resources: Which Midstream Energy Stock Is a Better Buy in 2026?
FLEX LNG vs. Targa Resources: Which Midstream Energy Stock Is a Better Buy in 2026?
FLNGNews tone: automated (AI) classification of the article's content, not a price prediction.
Technical indicators
- RSI 14
- 21.36
- MACD 12/26/9
- -1.19
- EMA 9 of MACD
- -1.00
- MACD histogram
- -0.19
- SMA 50
- $29.77
- Price below SMA 50
- EMA 50
- $28.97
- Price below EMA 50
- SMA 200
- $30.01
- Price below SMA 200
- EMA 200
- $29.19
- Price below EMA 200
Calculated by Gotrade from daily closing prices, as of November 11, 2026. Technical data, not a recommendation.
Analyst ratings
No analyst data available
Financials
Performance
Debt & Balance Sheet
Revenue to Profit
2025Earnings
No data available
Source: third-party data provider
Latest news
Eni Advances Coral North, Evaluates Third Mozambique LNG Facility
Eni Advances Coral North, Evaluates Third Mozambique LNG Facility
FLNGThese Shipping Stocks Yield Up to 9%. The Dividends Come With a Catch
These Shipping Stocks Yield Up to 9%. The Dividends Come With a Catch
FLNGFlex LNG Q2 Earnings Call Highlights
Flex LNG Q2 Earnings Call Highlights
FLNGFLEX LNG vs. Targa Resources: Which Midstream Energy Stock Is a Better Buy in 2026?
FLEX LNG vs. Targa Resources: Which Midstream Energy Stock Is a Better Buy in 2026?
FLNG
Flex LNG Q1 Earnings Call Highlights
Flex LNG Q1 Earnings Call Highlights
FLNG
While Asia and Europe scramble for natural gas, the US glut has nowhere to go
While Asia and Europe scramble for natural gas, the US glut has nowhere to go
FLNG
10 No-Brainer Stocks to Buy as Long as the Strait of Hormuz Is Closed
10 No-Brainer Stocks to Buy as Long as the Strait of Hormuz Is Closed
FLNG
5 Ripple Effects From the Strait of Hormuz Blockade Affecting Energy Stocks
5 Ripple Effects From the Strait of Hormuz Blockade Affecting Energy Stocks
FLNG
3 High-Yield Energy Stocks to Buy in March
3 High-Yield Energy Stocks to Buy in March
FLNG
Final Trades: Flex LNG, Palo Alto Networks and Apple
Final Trades: Flex LNG, Palo Alto Networks and Apple
FLNGNews tone: automated (AI) classification of the article's content, not a price prediction.
About FLEX LNG Ltd. Ordinary Shares
Flex LNG Ltd is an LNG shipping company with a fleet of next-generation LNG carriers with large cargo capacity. The fleet consists of thirteen modern LNG ships, ten existing and three under construction for delivery. All LNG carriers are equipped with slow-speed, two-stroke engines MEGI or X-DF propulsion which will provide Charterers with tonnage offering advantages in form of reduced fuel consumption and lowered boil-off rates.
Key Executives
| Name | Title | Year Born |
|---|---|---|
| Mr. Knut Traaholt | Principal Financial Officer | 1979 |
| Mr. Oystein M. Kalleklev | Advisor | 1980 |
| Mr. Halfdan Marius Foss | Principal Executive Officer | 1969 |
| Mr. Lars Pedersen | Chief Technical Officer of Frontline Management & MD of Flex Fleet Management | — |
| Ms. Jannicke Eilertsen | Head of Compliance of Flex LNG Management AS | — |
| Mr. Naren Senaratne | Chief Accounting Officer of Flex LNG Management Ltd | — |
| Mr. James Ayers | Company Secretary | 1982 |
Fundamentals
Valuation
Profitability
Trading
Dividend
Source: third-party data provider, as of November 13, 2026
Technical indicators
- RSI 14
- 21.36
- MACD 12/26/9
- -1.19
- EMA 9 of MACD
- -1.00
- MACD histogram
- -0.19
- SMA 50
- $29.77
- Price below SMA 50
- EMA 50
- $28.97
- Price below EMA 50
- SMA 200
- $30.01
- Price below SMA 200
- EMA 200
- $29.19
- Price below EMA 200
Calculated by Gotrade from daily closing prices, as of November 11, 2026. Technical data, not a recommendation.
Analyst views
No analyst data available
Seasonality
Monthly price change (%)| Jan | Feb | Mar | Apr | May | Jun | Jul | Aug | Sep | Oct | Nov | Dec | |
|---|---|---|---|---|---|---|---|---|---|---|---|---|
| 2026 | -1.2 | +5.3 | +10.7 | -7.9 | -7.1 | +9.0 | +2.7 | -2.3 | -9.4 | -7.2 |