
Fortuna Mining Corp. (FSM) Stock
Key stats
- Market cap
- $2.81B
- Price / Earnings ratio
- 10.2x
- EPS (TTM)
- $0.99
- Volume
- Loading
- 52-week high
- $13.85
- 52-week low
- $7.90
Source: third-party data provider, as of November 11, 2026
Compare with FSM
Recent news
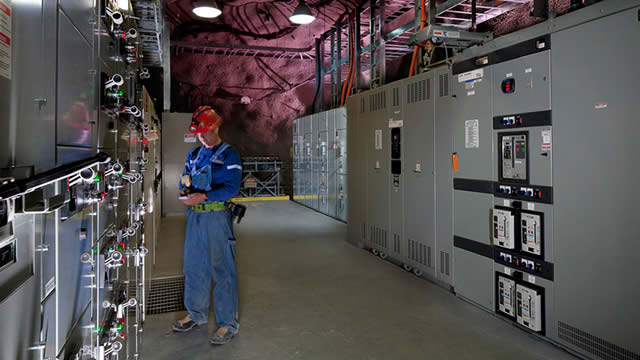
Fortuna Mining's Q3 Gold-Equivalent Production Dips Sequentially
Fortuna Mining's Q3 Gold-Equivalent Production Dips Sequentially
FSM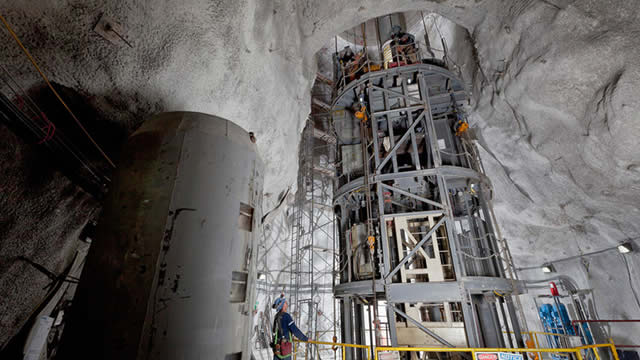
Fortuna Mining Targets 500,000 Gold Ounces With West Africa Expansion
Fortuna Mining Targets 500,000 Gold Ounces With West Africa Expansion
FSM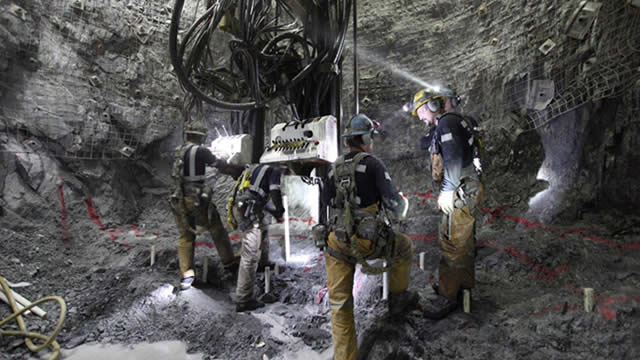
Wall Street Analysts See Fortuna (FSM) as a Buy: Should You Invest?
Wall Street Analysts See Fortuna (FSM) as a Buy: Should You Invest?
FSM
Fortuna Mining Q2 Earnings Call Highlights
Fortuna Mining Q2 Earnings Call Highlights
FSMNews tone: automated (AI) classification of the article's content, not a price prediction.
Technical indicators
- RSI 14
- 44.45
- MACD 12/26/9
- -0.34
- EMA 9 of MACD
- -0.43
- MACD histogram
- 0.09
- SMA 50
- $10.82
- Price below SMA 50
- EMA 50
- $10.27
- Price below EMA 50
- SMA 200
- $10.26
- Price below SMA 200
- EMA 200
- $10.26
- Price below EMA 200
Calculated by Gotrade from daily closing prices, as of November 10, 2026. Technical data, not a recommendation.
Analyst ratings
No analyst data available
Financials
Performance
Debt & Balance Sheet
Revenue to Profit
2025Earnings
The market is expecting earnings per share of $0.33 for this quarter. The company has not yet shared when it is announcing earnings.
Source: third-party data provider
Latest news
Fortuna Mining's Q3 Gold-Equivalent Production Dips Sequentially
Fortuna Mining's Q3 Gold-Equivalent Production Dips Sequentially
FSMFortuna Mining Targets 500,000 Gold Ounces With West Africa Expansion
Fortuna Mining Targets 500,000 Gold Ounces With West Africa Expansion
FSMWall Street Analysts See Fortuna (FSM) as a Buy: Should You Invest?
Wall Street Analysts See Fortuna (FSM) as a Buy: Should You Invest?
FSMFortuna Mining Q2 Earnings Call Highlights
Fortuna Mining Q2 Earnings Call Highlights
FSM
Royal Gold's Q2 Gold-Equivalent Ounces Sales Jump 8% Y/Y
Royal Gold's Q2 Gold-Equivalent Ounces Sales Jump 8% Y/Y
FSM
Fortuna Mining's H1 Gold-Equivalent Production Hits 145,089 Ounces
Fortuna Mining's H1 Gold-Equivalent Production Hits 145,089 Ounces
FSM
New Strong Sell Stocks for June 26th
New Strong Sell Stocks for June 26th
FSM
FSM Advances Diamba Sud Project With Environmental Approval
FSM Advances Diamba Sud Project With Environmental Approval
FSM
Fortuna Mining Q1 Earnings Call Highlights
Fortuna Mining Q1 Earnings Call Highlights
FSM
Fortuna Mining's Q1 Gold-Equivalent Production Increases Sequentially
Fortuna Mining's Q1 Gold-Equivalent Production Increases Sequentially
FSMNews tone: automated (AI) classification of the article's content, not a price prediction.
About Fortuna Mining Corp.
Fortuna Mining Corp is a Canadian-based precious metals mining company with mines in the Latin America and West Africa regions producing gold and silver. It operate mines in Argentina, Burkina Faso, Cote d'Ivoire, Mexico, and Peru. The company's segment consists of Mansfield, Sanu, Sango, Cuzcatlan, Bateas, Corporate. The company generates the majority of its revenue from Sango segment which operates the Seguela gold mine. Geographically, the company generates the majority of its revenue from Cote d'Ivoire location.
Key Executives
| Name | Title | Year Born |
|---|---|---|
| Mr. Jorge A. Ganoza Durant B.Sc., Eng | Co-Founder, CEO & Director | 1970 |
| Mr. Cesar E. Velasco | Chief Operating Officer of Latin America | — |
| Mr. David Edward Whittle B.Com., B.Comm., C.A., CPA | Chief Operating Officer of West Africa | 1965 |
| Mr. Kevin O'Reilly | Chief Financial Officer | — |
| Mr. Luis Dario Ganoza Durant B.Sc., BSc Eng., M.B.A., M.Sc. | President | 1971 |
| Mr. Mario D. Szotlender | Co-Founder & Director | 1961 |
| Mr. Eric N. Chapman P.Geo. | Senior Vice President of Technical Services | — |
| Mr. Carlos Baca | Vice President of Investor Relations | — |
| Ms. Linda Desaulniers | Corporate Counsel & Chief Compliance Officer | — |
| Mr. Armando Nakamura | Vice President of People | — |
Fundamentals
Valuation
Profitability
Trading
Source: third-party data provider, as of November 11, 2026
Technical indicators
- RSI 14
- 44.45
- MACD 12/26/9
- -0.34
- EMA 9 of MACD
- -0.43
- MACD histogram
- 0.09
- SMA 50
- $10.82
- Price below SMA 50
- EMA 50
- $10.27
- Price below EMA 50
- SMA 200
- $10.26
- Price below SMA 200
- EMA 200
- $10.26
- Price below EMA 200
Calculated by Gotrade from daily closing prices, as of November 10, 2026. Technical data, not a recommendation.
Analyst views
No analyst data available
Seasonality
Monthly price change (%)| Jan | Feb | Mar | Apr | May | Jun | Jul | Aug | Sep | Oct | Nov | Dec | |
|---|---|---|---|---|---|---|---|---|---|---|---|---|
| 2021 | -10.1 | +20.0 | ||||||||||
| 2022 | -12.8 | +5.1 | -6.8 | -12.1 | -4.1 | -16.5 | -2.7 | -19.0 | +15.1 | +2.2 | +30.4 | -1.8 |
| 2023 | +1.9 | -19.3 | +14.7 | -4.4 | -11.5 | -7.7 | +7.9 | -8.8 | -9.0 | +6.4 | +39.3 | -4.5 |
| 2024 | -18.8 | -15.0 | +28.2 | +18.5 | +33.0 | -21.1 | -0.2 | -0.6 | +9.2 | +4.0 | -2.4 | -5.5 |
| 2025 | +10.7 | -16.1 | +42.2 | +2.0 | -1.7 | -0.3 | -3.3 | +20.5 | +15.2 | -7.0 | +23.1 | -1.1 |
| 2026 | +2.5 | +39.4 | -26.8 | -7.5 | +6.1 | -14.5 | +1.0 | +39.3 | -4.3 | -20.5 | +4.5 |