Golar LNG Ltd. (GLNG) Stock
Key stats
- Market cap
- $4.37B
- Price / Earnings ratio
- 67.1x
- EPS (TTM)
- $0.64
- Volume
- Loading
- 52-week high
- $57.79
- 52-week low
- $35.02
- Dividend yield
- 2.34%
- Dividend amount (latest)
- $1.00
Source: third-party data provider, as of November 13, 2026
Compare with GLNG
Recent news

GLNG Acquires Vessel for Fourth FLNG Project, Targeting 2029 Delivery
GLNG Acquires Vessel for Fourth FLNG Project, Targeting 2029 Delivery
GLNG
Golar LNG Q2 Earnings & Revenues Top Estimates, Improve Y/Y
Golar LNG Q2 Earnings & Revenues Top Estimates, Improve Y/Y
GLNG
Golar LNG Q2 Earnings Call Highlights
Golar LNG Q2 Earnings Call Highlights
GLNG
Golar LNG (GLNG) Q2 Earnings and Revenues Beat Estimates
Golar LNG (GLNG) Q2 Earnings and Revenues Beat Estimates
GLNGNews tone: automated (AI) classification of the article's content, not a price prediction.
Technical indicators
- RSI 14
- 35.67
- MACD 12/26/9
- -1.27
- EMA 9 of MACD
- -1.18
- MACD histogram
- -0.08
- SMA 50
- $47.94
- Price below SMA 50
- EMA 50
- $47.00
- Price below EMA 50
- SMA 200
- $49.61
- Price below SMA 200
- EMA 200
- $47.27
- Price below EMA 200
Calculated by Gotrade from daily closing prices, as of November 11, 2026. Technical data, not a recommendation.
Analyst ratings
Analyst consensus: Buy
Based on 1 analyst rating
Third-party analyst opinion, not a recommendation from Gotrade.
Financials
Performance
Debt & Balance Sheet
Revenue to Profit
2025Earnings
No data available
Source: third-party data provider
Latest news
GLNG Acquires Vessel for Fourth FLNG Project, Targeting 2029 Delivery
GLNG Acquires Vessel for Fourth FLNG Project, Targeting 2029 Delivery
GLNGGolar LNG Q2 Earnings & Revenues Top Estimates, Improve Y/Y
Golar LNG Q2 Earnings & Revenues Top Estimates, Improve Y/Y
GLNGGolar LNG Q2 Earnings Call Highlights
Golar LNG Q2 Earnings Call Highlights
GLNGGolar LNG (GLNG) Q2 Earnings and Revenues Beat Estimates
Golar LNG (GLNG) Q2 Earnings and Revenues Beat Estimates
GLNG
Golar LNG (GLNG) Down 5.2% Since Last Earnings Report: Can It Rebound?
Golar LNG (GLNG) Down 5.2% Since Last Earnings Report: Can It Rebound?
GLNG
Golar LNG Q1 Earnings & Revenues Top Estimates, Improve Y/Y
Golar LNG Q1 Earnings & Revenues Top Estimates, Improve Y/Y
GLNG
Golar LNG Q1 Earnings Call Highlights
Golar LNG Q1 Earnings Call Highlights
GLNG
One-Of-A-Kind LNG Stock Eyes Buy Point On Earnings, Expansion
One-Of-A-Kind LNG Stock Eyes Buy Point On Earnings, Expansion
GLNG
Golar LNG (GLNG) Q1 Earnings and Revenues Surpass Estimates
Golar LNG (GLNG) Q1 Earnings and Revenues Surpass Estimates
GLNG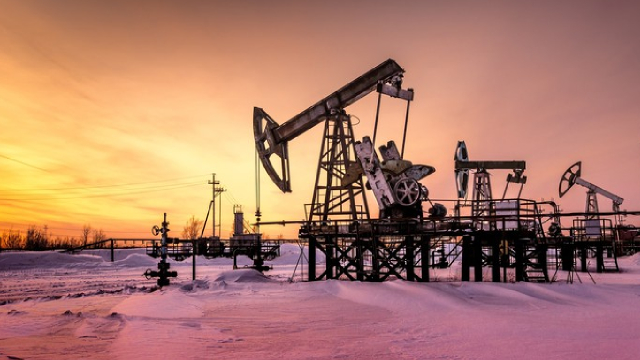
While Asia and Europe scramble for natural gas, the US glut has nowhere to go
While Asia and Europe scramble for natural gas, the US glut has nowhere to go
GLNGNews tone: automated (AI) classification of the article's content, not a price prediction.
About Golar LNG Ltd.
Golar LNG Ltd is a midstream LNG company that operates in the transportation, regasification, liquefaction, and trading of LNG. The segment in which the group operates includes Shipping, FLNG (Floating Liquefaction Natural Gas vessels), and Corporate and other. It generates maximum revenue from the FLNG segment.
Key Executives
| Name | Title | Year Born |
|---|---|---|
| Mr. Karl Fredrik Staubo | Chief Executive Officer of Golar Management AS | 1987 |
| Mr. Eduardo Maranhao | Chief Financial Officer of Golar Management Ltd | 1983 |
| Mr. Ragnar Nes | Chief Operating Officer of Golar Management AS | 1969 |
| Mr. Dexter Chan | Chief Accounting Officer of Golar Management Ltd | 1981 |
| Mr. Morten Skjong | Chief Technical Officer of Golar Management Ltd. | 1987 |
| Mr. Federico Petersen | Chief Commercial Officer of Golar Management Ltd. | 1970 |
| Mr. Stuart Buchanan | Head of Investor Relations | — |
| Ms. Mi Hong Yoon | Company Secretary & Director | 1970 |
Fundamentals
Valuation
Profitability
Trading
Dividend
Source: third-party data provider, as of November 13, 2026
Technical indicators
- RSI 14
- 35.67
- MACD 12/26/9
- -1.27
- EMA 9 of MACD
- -1.18
- MACD histogram
- -0.08
- SMA 50
- $47.94
- Price below SMA 50
- EMA 50
- $47.00
- Price below EMA 50
- SMA 200
- $49.61
- Price below SMA 200
- EMA 200
- $47.27
- Price below EMA 200
Calculated by Gotrade from daily closing prices, as of November 11, 2026. Technical data, not a recommendation.
Analyst views
1 analyst rating
Third-party analyst opinion, not a recommendation from Gotrade.
- Low
- $75.00
- Average
- $75.00
- High
- $75.00
Seasonality
Monthly price change (%)| Jan | Feb | Mar | Apr | May | Jun | Jul | Aug | Sep | Oct | Nov | Dec | |
|---|---|---|---|---|---|---|---|---|---|---|---|---|
| 2021 | -11.3 | +9.7 | ||||||||||
| 2022 | +9.2 | +16.4 | +40.9 | -10.9 | +12.6 | -14.7 | +1.7 | +22.0 | -4.3 | +8.5 | -8.2 | -9.1 |
| 2023 | +6.1 | -4.0 | -5.0 | +5.8 | -7.0 | -4.6 | +20.2 | -7.9 | +6.0 | -3.9 | -4.1 | +6.5 |
| 2024 | -6.4 | -7.8 | +15.8 | +1.6 | +7.0 | +20.3 | +10.3 | -2.9 | +14.7 | -5.2 | +9.6 | +6.7 |
| 2025 | -7.0 | -8.0 | +3.2 | +14.7 | -3.3 | -1.2 | +2.6 | +8.3 | -6.3 | +2.3 | -10.4 | +0.7 |
| 2026 | +7.0 | +7.9 | +17.3 | +2.5 | -10.7 | -1.5 | -1.1 | +4.7 | -9.2 | -4.3 | -4.2 |
Corporate actions
Upcoming
No upcoming corporate actions for GLNG