HP (HP) Stock
Key stats
- Market cap
- $3.71B
- Price / Earnings ratio
- -27.3x
- EPS (TTM)
- $6.88
- Volume
- Loading
- 52-week high
- $48.17
- 52-week low
- $23.11
- Dividend yield
- 2.62%
- Dividend amount (latest)
- $0.25
Source: third-party data provider, as of October 23, 2026
Compare with HP
Recent news

Helmerich & Payne, Inc. Schedules Fiscal Fourth Quarter 2026 and Year End Conference Call and Webcast
Helmerich & Payne, Inc. Schedules Fiscal Fourth Quarter 2026 and Year End Conference Call and Webcast
HP
Are Investors Undervaluing Helmerich & Payne (HP) Right Now?
Are Investors Undervaluing Helmerich & Payne (HP) Right Now?
HP
Top 3D Printing Stocks to Buy for Solid Long-Term Returns
Top 3D Printing Stocks to Buy for Solid Long-Term Returns
HP
Why Is Helmerich & Payne (HP) Up 21.5% Since Last Earnings Report?
Why Is Helmerich & Payne (HP) Up 21.5% Since Last Earnings Report?
HPNews tone: automated (AI) classification of the article's content, not a price prediction.
Technical indicators
- RSI 14
- 38.01
- MACD 12/26/9
- -0.76
- EMA 9 of MACD
- -0.71
- MACD histogram
- -0.05
- SMA 50
- $41.21
- Price below SMA 50
- EMA 50
- $39.42
- Price below EMA 50
- SMA 200
- $37.04
- Price above SMA 200
- EMA 200
- $36.54
- Price above EMA 200
Calculated by Gotrade from daily closing prices, as of October 22, 2026. Technical data, not a recommendation.
Analyst ratings
Analyst consensus: Buy
Based on 6 analyst ratings
Third-party analyst opinion, not a recommendation from Gotrade.
Financials
Performance
Debt & Balance Sheet
Revenue to Profit
2025Earnings
The market is expecting earnings per share of $0.08 for this quarter. The company has not yet shared when it is announcing earnings.
Source: third-party data provider
Latest news
Helmerich & Payne, Inc. Schedules Fiscal Fourth Quarter 2026 and Year End Conference Call and Webcast
Helmerich & Payne, Inc. Schedules Fiscal Fourth Quarter 2026 and Year End Conference Call and Webcast
HPAre Investors Undervaluing Helmerich & Payne (HP) Right Now?
Are Investors Undervaluing Helmerich & Payne (HP) Right Now?
HPTop 3D Printing Stocks to Buy for Solid Long-Term Returns
Top 3D Printing Stocks to Buy for Solid Long-Term Returns
HPWhy Is Helmerich & Payne (HP) Up 21.5% Since Last Earnings Report?
Why Is Helmerich & Payne (HP) Up 21.5% Since Last Earnings Report?
HP
Helmerich & Payne Q3 Earnings Miss Estimates, Revenues Beat
Helmerich & Payne Q3 Earnings Miss Estimates, Revenues Beat
HP
Is HP Attractive as Low Valuation Meets Persistent Earnings Pressure?
Is HP Attractive as Low Valuation Meets Persistent Earnings Pressure?
HP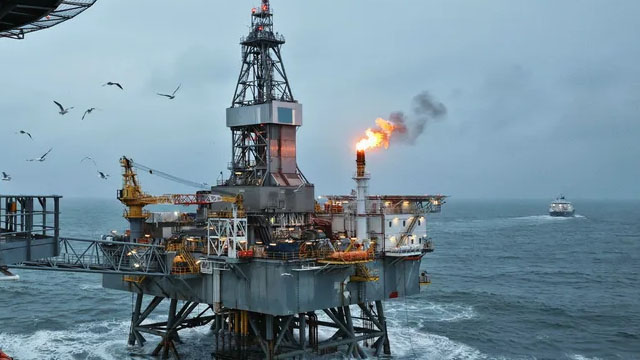
3 Oil & Gas Drilling Stocks Bucking a Bearish Industry Trend
3 Oil & Gas Drilling Stocks Bucking a Bearish Industry Trend
HP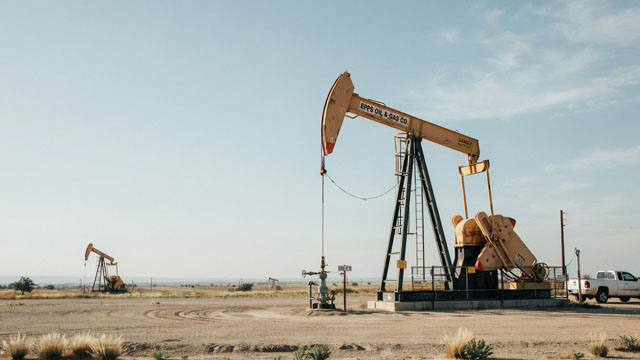
Helmerich & Payne Q3 Earnings Call Highlights
Helmerich & Payne Q3 Earnings Call Highlights
HP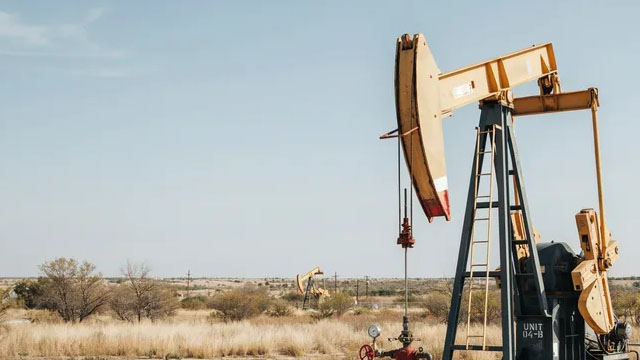
Helmerich & Payne (HP) Q3 Earnings: Taking a Look at Key Metrics Versus Estimates
Helmerich & Payne (HP) Q3 Earnings: Taking a Look at Key Metrics Versus Estimates
HP
Formentera Partners Scales Up U.S. Shale Technology in Australia
Formentera Partners Scales Up U.S. Shale Technology in Australia
HPNews tone: automated (AI) classification of the article's content, not a price prediction.
About HP
Helmerich & Payne Inc provides performance-driven drilling solutions and technologies to make hydrocarbon recovery safer and more economical for oil and gas exploration and production companies. Focusing on the drilling segment, its technology services develop and commercialize solutions that improve drilling efficiency, accuracy, and wellbore quality and placement. The company operates through North America Solutions, International Solutions, and Offshore Solutions segments. The North America segment runs a technologically advanced AC drive drilling rig fleet in the U.S., with a presence in shale and unconventional basins, while the Offshore Solutions segment, operating rigs on fixed-leg and floating platforms, generates the majority of revenue.
Key Executives
| Name | Title | Year Born |
|---|---|---|
| Mr. Raymond John Adams III | CEO, President & Director | 1986 |
| Mr. Todd Scruggs | Senior VP & CFO | — |
| Ms. Cara M. Hair J.D. | Senior VP of Corporate Services and Chief Legal & Compliance Officer | 1976 |
| Mr. John W. Lindsay | Senior Advisor | 1961 |
| Mr. John Ruskin Bell Sr. | Executive Vice President of Eastern Hemisphere Land Operations | 1970 |
| Mr. Michael P. Lennox | Executive Vice President of Western Hemisphere Land Operations | 1981 |
| Mr. J. Kevin Vann | Advisor | 1971 |
| Ms. Sara Marie Momper | VP & Chief Accounting Officer | 1984 |
| Kris Nicol | Vice President of Investor Relations | — |
| Valerie Vaughan | Vice President Human Resources Strategy & Transformation | — |
Fundamentals
Valuation
Profitability
Trading
Dividend
Source: third-party data provider, as of October 23, 2026
Technical indicators
- RSI 14
- 38.01
- MACD 12/26/9
- -0.76
- EMA 9 of MACD
- -0.71
- MACD histogram
- -0.05
- SMA 50
- $41.21
- Price below SMA 50
- EMA 50
- $39.42
- Price below EMA 50
- SMA 200
- $37.04
- Price above SMA 200
- EMA 200
- $36.54
- Price above EMA 200
Calculated by Gotrade from daily closing prices, as of October 22, 2026. Technical data, not a recommendation.
Analyst views
6 analyst ratings
Third-party analyst opinion, not a recommendation from Gotrade.
- Low
- $41.00
- Average
- $48.17
- High
- $51.00
Seasonality
Monthly price change (%)| Jan | Feb | Mar | Apr | May | Jun | Jul | Aug | Sep | Oct | Nov | Dec | |
|---|---|---|---|---|---|---|---|---|---|---|---|---|
| 2021 | -8.4 | -30.6 | +11.4 | |||||||||
| 2022 | +13.4 | +19.3 | +17.1 | +4.1 | +12.0 | -15.3 | +6.4 | -5.6 | -9.7 | +27.3 | +4.0 | -0.3 |
| 2023 | +5.0 | -9.9 | -16.6 | -13.7 | -6.5 | +11.8 | +24.4 | -10.0 | +1.3 | -1.9 | -7.8 | -0.9 |
| 2024 | +10.6 | -2.3 | +7.9 | -6.9 | -0.4 | +0.1 | +13.1 | -15.3 | -4.2 | +6.4 | +5.2 | -9.0 |
| 2025 | -4.6 | -15.0 | +5.8 | -28.7 | -22.4 | -3.4 | +1.8 | +33.4 | +4.1 | +13.6 | +3.7 | +1.1 |
| 2026 | +13.2 | +2.8 | +2.7 | +16.9 | -5.6 | -16.5 | +11.8 | +27.6 | -19.6 | -2.8 |