Insteel Industries Inc (IIIN) Stock
Key stats
- Market cap
- $540.93M
- Price / Earnings ratio
- 18.0x
- EPS (TTM)
- $1.52
- Volume
- Loading
- 52-week high
- $38.45
- 52-week low
- $24.35
- Dividend yield
- 4.01%
- Dividend amount (latest)
- $0.03
Source: third-party data provider, as of November 13, 2026
Compare with IIIN
Recent news

Insteel: 3 Key Takeaways for Long-Term Investors
Insteel: 3 Key Takeaways for Long-Term Investors
IIIN
Insteel Industries Q4 Earnings Call Highlights
Insteel Industries Q4 Earnings Call Highlights
IIIN
Insteel Industries (IIIN) Q4 Earnings Lag Estimates
Insteel Industries (IIIN) Q4 Earnings Lag Estimates
IIIN
Insteel Industries Reports Fourth Quarter 2026 Results
Insteel Industries Reports Fourth Quarter 2026 Results
IIINNews tone: automated (AI) classification of the article's content, not a price prediction.
Technical indicators
- RSI 14
- 44.61
- MACD 12/26/9
- -0.56
- EMA 9 of MACD
- -0.49
- MACD histogram
- -0.08
- SMA 50
- $29.41
- Price below SMA 50
- EMA 50
- $29.21
- Price below EMA 50
- SMA 200
- $30.72
- Price below SMA 200
- EMA 200
- $30.58
- Price below EMA 200
Calculated by Gotrade from daily closing prices, as of November 11, 2026. Technical data, not a recommendation.
Analyst ratings
No analyst data available
Financials
Performance
Debt & Balance Sheet
Revenue to Profit
2026Earnings
No data available
Source: third-party data provider
Latest news
Insteel: 3 Key Takeaways for Long-Term Investors
Insteel: 3 Key Takeaways for Long-Term Investors
IIINInsteel Industries Q4 Earnings Call Highlights
Insteel Industries Q4 Earnings Call Highlights
IIINInsteel Industries (IIIN) Q4 Earnings Lag Estimates
Insteel Industries (IIIN) Q4 Earnings Lag Estimates
IIINInsteel Industries Reports Fourth Quarter 2026 Results
Insteel Industries Reports Fourth Quarter 2026 Results
IIIN
IIIN vs. CRS: Which Stock Is the Better Value Option?
IIIN vs. CRS: Which Stock Is the Better Value Option?
IIIN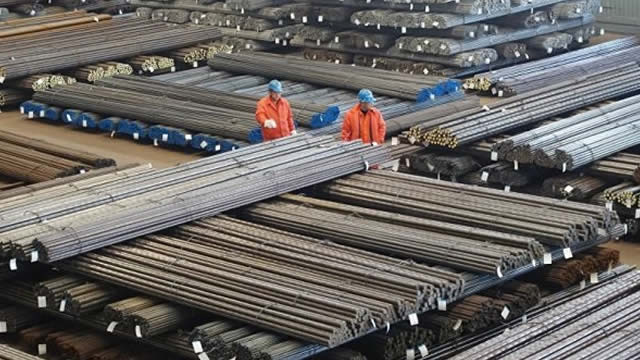
Insteel Industries (IIIN) Expected to Beat Earnings Estimates: Should You Buy?
Insteel Industries (IIIN) Expected to Beat Earnings Estimates: Should You Buy?
IIIN
IIIN or NWPX: Which Is the Better Value Stock Right Now?
IIIN or NWPX: Which Is the Better Value Stock Right Now?
IIIN
Insteel Industries Announces Fourth Quarter 2026 Conference Call
Insteel Industries Announces Fourth Quarter 2026 Conference Call
IIIN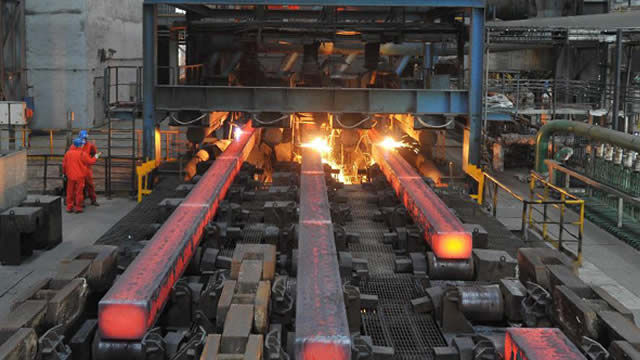
IIIN or NWPX: Which Is the Better Value Stock Right Now?
IIIN or NWPX: Which Is the Better Value Stock Right Now?
IIIN
Insteel Industries Announces Closure of Upper Sandusky, Ohio Facility
Insteel Industries Announces Closure of Upper Sandusky, Ohio Facility
IIINNews tone: automated (AI) classification of the article's content, not a price prediction.
About Insteel Industries Inc
Insteel Industries Inc produces and sells prestressed concrete strand (PC strand) and welded wire reinforcement (WWR). PC strand, a high-strength seven-wire cable, is used to strengthen precast concrete in structures like bridges, parking decks, and buildings, enabling longer spans and slimmer designs. WWR includes engineered structural mesh for primary reinforcement, concrete pipe reinforcement for drainage and sewage systems, and standard WWR for crack control in residential and light commercial construction. The company serves markets in the United States and internationally, with the majority of revenue generated in the United States.
Key Executives
| Name | Title | Year Born |
|---|---|---|
| Mr. Howard Osler Woltz III | President, CEO & Chairman | 1956 |
| Mr. Scot R. Jafroodi | VP, CFO & Treasurer | 1970 |
| Mr. Richard T. Wagner | Senior VP & COO | 1959 |
| Mr. James R. York | Senior Vice President of Sourcing & Logistics | — |
Fundamentals
Valuation
Profitability
Trading
Dividend
Source: third-party data provider, as of November 13, 2026
Technical indicators
- RSI 14
- 44.61
- MACD 12/26/9
- -0.56
- EMA 9 of MACD
- -0.49
- MACD histogram
- -0.08
- SMA 50
- $29.41
- Price below SMA 50
- EMA 50
- $29.21
- Price below EMA 50
- SMA 200
- $30.72
- Price below SMA 200
- EMA 200
- $30.58
- Price below EMA 200
Calculated by Gotrade from daily closing prices, as of November 11, 2026. Technical data, not a recommendation.
Analyst views
No analyst data available
Seasonality
Monthly price change (%)| Jan | Feb | Mar | Apr | May | Jun | Jul | Aug | Sep | Oct | Nov | Dec | |
|---|---|---|---|---|---|---|---|---|---|---|---|---|
| 2021 | -2.7 | -0.9 | ||||||||||
| 2022 | -5.6 | -6.9 | +1.6 | +14.4 | -4.3 | -20.9 | -12.4 | -6.3 | -5.6 | -3.8 | +13.1 | -8.2 |
| 2023 | +6.2 | -2.5 | -8.3 | -1.1 | +8.1 | +4.7 | +2.9 | +8.9 | -9.1 | -14.2 | +21.1 | +9.5 |
| 2024 | -8.3 | +3.2 | +5.4 | -13.7 | +3.2 | -3.2 | +6.1 | |||||
| 2026 | +0.0 | +1.0 | -3.2 | -3.1 | -2.0 | -3.1 |