RYERSON HOLDING CORPORATION (RYZ) Stock
Key stats
- Market cap
- $1.58B
- Price / Earnings ratio
- 110.4x
- EPS (TTM)
- -$0.15
- Volume
- Loading
- 52-week high
- $33.72
- 52-week low
- $19.34
- Dividend yield
- 2.47%
- Dividend amount (latest)
- $0.19
Source: third-party data provider, as of November 13, 2026
Compare with RYZ
Recent news
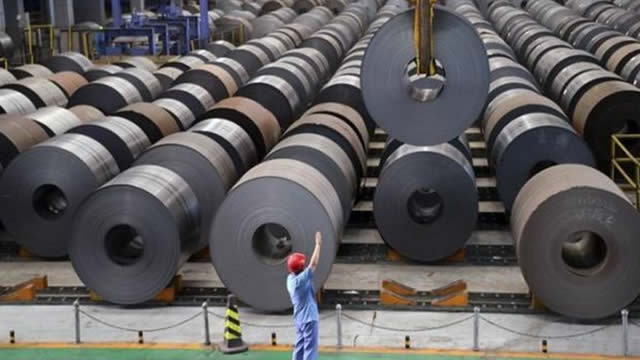
Fast-paced Momentum Stock Ryerson (RYZ) Is Still Trading at a Bargain
Fast-paced Momentum Stock Ryerson (RYZ) Is Still Trading at a Bargain
RYZ
Constellium vs. Ryerson: Which Stock Has More Upside Potential Now?
Constellium vs. Ryerson: Which Stock Has More Upside Potential Now?
RYZ
Alcoa vs. Ryerson: Which Aluminum Stock Boasts Better Prospects?
Alcoa vs. Ryerson: Which Aluminum Stock Boasts Better Prospects?
RYZ
Constellium vs. Ryerson: Which Aluminum Stock Should You Bet On?
Constellium vs. Ryerson: Which Aluminum Stock Should You Bet On?
RYZNews tone: automated (AI) classification of the article's content, not a price prediction.
Technical indicators
- RSI 14
- 57.41
- MACD 12/26/9
- 0.92
- EMA 9 of MACD
- 1.05
- MACD histogram
- -0.12
- SMA 50
- $26.79
- Price above SMA 50
- EMA 50
- $27.80
- Price above EMA 50
Calculated by Gotrade from daily closing prices, as of November 11, 2026. Technical data, not a recommendation.
Analyst ratings
No analyst data available
Financials
Performance
Debt & Balance Sheet
Revenue to Profit
2025Earnings
No data available
Source: third-party data provider
Latest news
Fast-paced Momentum Stock Ryerson (RYZ) Is Still Trading at a Bargain
Fast-paced Momentum Stock Ryerson (RYZ) Is Still Trading at a Bargain
RYZConstellium vs. Ryerson: Which Stock Has More Upside Potential Now?
Constellium vs. Ryerson: Which Stock Has More Upside Potential Now?
RYZAlcoa vs. Ryerson: Which Aluminum Stock Boasts Better Prospects?
Alcoa vs. Ryerson: Which Aluminum Stock Boasts Better Prospects?
RYZConstellium vs. Ryerson: Which Aluminum Stock Should You Bet On?
Constellium vs. Ryerson: Which Aluminum Stock Should You Bet On?
RYZNews tone: automated (AI) classification of the article's content, not a price prediction.
About RYERSON HOLDING CORPORATION
Ryerson Holding Corp provides a metals service center, and value-added processor and is a distributor of industrial metals with operations in the United States, Canada, and Mexico. In addition to its North American operations, it conducts processing and distribution operations in China. Its customers range from local, independently owned fabricators and machine shops to large, international original equipment manufacturers. It carries a full line of products in stainless steel, aluminum, carbon steel, and alloy steels and a limited line of nickel and red metals in various shapes and forms. The company generates substantially all of its revenue from sales of metal products. Geographically, the majority revenue is generated from the United States.
Key Executives
| Name | Title | Year Born |
|---|---|---|
| Mr. Edward J. Lehner CPA | CEO & Director | 1966 |
| Mr. James J. Claussen | Executive VP & CFO | 1973 |
| Mr. Richard T. Marabito | President, COO & Director | 1964 |
| Ms. Molly D. Kannan CPA | Corporate Controller & Chief Accounting Officer | 1982 |
| Mr. Mark S. Silver J.D. | Executive VP and Chief Legal & Risk Officer | 1971 |
| Mr. Frank Williams | Chief Information Officer | — |
| Mr. Richard A. Manson CPA | Senior Vice President of Finance | 1969 |
| Mr. Andrew S. Greiff | Executive Vice President & President of Olympic Steel | 1961 |
| Mr. Daniel Rosenberg | Chief of Staff | — |
| Mr. Brian Seeley | President ? Ryerson Advanced Processing | — |
Fundamentals
Valuation
Profitability
Trading
Dividend
Source: third-party data provider, as of November 13, 2026
Technical indicators
- RSI 14
- 57.41
- MACD 12/26/9
- 0.92
- EMA 9 of MACD
- 1.05
- MACD histogram
- -0.12
- SMA 50
- $26.79
- Price above SMA 50
- EMA 50
- $27.80
- Price above EMA 50
Calculated by Gotrade from daily closing prices, as of November 11, 2026. Technical data, not a recommendation.
Analyst views
No analyst data available
Seasonality
Monthly price change (%)| Jan | Feb | Mar | Apr | May | Jun | Jul | Aug | Sep | Oct | Nov | Dec | |
|---|---|---|---|---|---|---|---|---|---|---|---|---|
| 2026 | -3.9 | -18.4 | +22.6 | +3.0 | -11.3 | +16.9 | -10.9 | -7.0 | +27.1 | -8.4 |