LTC Properties (LTC) Stock
Key stats
- Market cap
- $2.37B
- Price / Earnings ratio
- 4.7x
- EPS (TTM)
- $9.70
- Volume
- Loading
- 52-week high
- $46.92
- 52-week low
- $33.64
- Dividend yield
- 5.85%
- Dividend amount (latest)
- $0.57
- EPS vs analyst estimate
- +27.8%Q3 FY25 · $0.69 vs $0.54
Source: third-party data provider, as of November 22, 2026
EPS estimate: analyst consensus
Compare with LTC
Recent news

The IRS Takes Up to 37% of These 5 Monthly Dividend Payers (Unless You Move Them)
The IRS Takes Up to 37% of These 5 Monthly Dividend Payers (Unless You Move Them)
LTC
What LTC Properties (LTC) Said on Its Q3 Earnings Call
What LTC Properties (LTC) Said on Its Q3 Earnings Call
LTC
LTC Properties (LTC) Beats Q3 FFO and Revenue Estimates
LTC Properties (LTC) Beats Q3 FFO and Revenue Estimates
LTC
LTC Reports 2026 Third Quarter Results as SHOP Momentum Continues
LTC Reports 2026 Third Quarter Results as SHOP Momentum Continues
LTCNews tone: automated (AI) classification of the article's content, not a price prediction.
Technical indicators
- RSI 14
- 41.40
- MACD 12/26/9
- -0.28
- EMA 9 of MACD
- 0.09
- MACD histogram
- -0.36
- SMA 50
- $43.28
- Price below SMA 50
- EMA 50
- $43.00
- Price below EMA 50
- SMA 200
- $40.05
- Price above SMA 200
- EMA 200
- $40.17
- Price above EMA 200
Calculated by Gotrade from daily closing prices, as of November 20, 2026. Technical data, not a recommendation.
Analyst ratings
Analyst consensus: Hold
Based on 3 analyst ratings
Third-party analyst opinion, not a recommendation from Gotrade.
Financials
Performance
Debt & Balance Sheet
Revenue to Profit
2025Earnings
Source: third-party data provider
Latest news
The IRS Takes Up to 37% of These 5 Monthly Dividend Payers (Unless You Move Them)
The IRS Takes Up to 37% of These 5 Monthly Dividend Payers (Unless You Move Them)
LTCWhat LTC Properties (LTC) Said on Its Q3 Earnings Call
What LTC Properties (LTC) Said on Its Q3 Earnings Call
LTCLTC Properties (LTC) Beats Q3 FFO and Revenue Estimates
LTC Properties (LTC) Beats Q3 FFO and Revenue Estimates
LTCLTC Reports 2026 Third Quarter Results as SHOP Momentum Continues
LTC Reports 2026 Third Quarter Results as SHOP Momentum Continues
LTC
LTC Tops 2026 Mid-Point SHOP Acquisition Guidance with $62 Million Transaction; Welcomes Grace Management to SHOP Platform
LTC Tops 2026 Mid-Point SHOP Acquisition Guidance with $62 Million Transaction; Welcomes Grace Management to SHOP Platform
LTC
LTC Appoints Real Estate Capital Markets Veteran Eric Clark as Senior Vice President, Corporate Finance and Investor Relations
LTC Appoints Real Estate Capital Markets Veteran Eric Clark as Senior Vice President, Corporate Finance and Investor Relations
LTC
The Aging Boomer Landlords: 5 Senior Housing REITs and What Their Yields Are Telling You
The Aging Boomer Landlords: 5 Senior Housing REITs and What Their Yields Are Telling You
LTC
LTC Approaches 2026 SHOP Acquisition Target of $900 Million with Recent $52 Million Investment
LTC Approaches 2026 SHOP Acquisition Target of $900 Million with Recent $52 Million Investment
LTC
LTC Announces Date of Third Quarter 2026 Earnings Release, Conference Call and Webcast
LTC Announces Date of Third Quarter 2026 Earnings Release, Conference Call and Webcast
LTC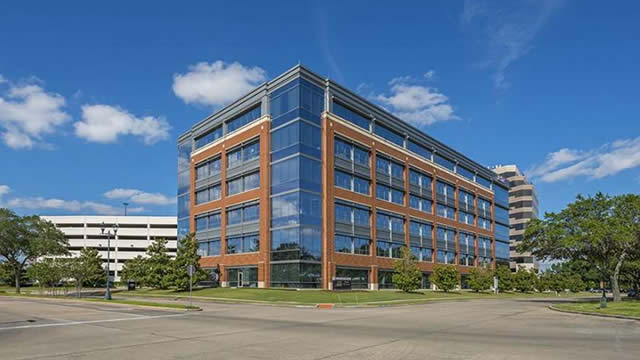
These 5 REITs Own Something America Is Running Short Of: Senior Housing
These 5 REITs Own Something America Is Running Short Of: Senior Housing
LTCNews tone: automated (AI) classification of the article's content, not a price prediction.
About LTC Properties
LTC is a real estate investment trust (REIT) investing in seniors housing and health care properties primarily through sale-leasebacks, mortgage financing, joint-ventures and structured finance solutions including preferred equity and mezzanine lending. The portfolio is comprised of investments of approximately 50% seniors housing and 50% skilled nursing properties.
Key Executives
| Name | Title | Year Born |
|---|---|---|
| Ms. Pamela J. Shelley-Kessler CPA | Co-CEO, Co-President & Director | 1966 |
| Mr. Clint B. Malin | Co-CEO, Co-President & Director | 1972 |
| Ms. Wendy L. Simpson | Executive Chairman of the Board | 1949 |
| Ms. Caroline L. Chikhale CPA | Executive VP, CFO, Secretary, Chief Accounting Officer & Treasurer | 1977 |
| Mr. David M. Boitano | Executive VP & Chief Investment Officer | 1961 |
| Mr. John Gibson Satterwhite | Executive Vice President of Asset Management | 1976 |
| Mr. Eric Clark | Senior Vice President of Corporate Finance & Investor Relations | — |
| Ms. Mandi M. Hogan | Senior Vice President of Marketing | — |
| Mr. Michael D. Bowden | Senior Vice President of Investments | — |
| Ms. H. Rachel Son | VP & Controller | — |
Fundamentals
Valuation
Profitability
Trading
Dividend
Source: third-party data provider, as of November 22, 2026
Technical indicators
- RSI 14
- 41.40
- MACD 12/26/9
- -0.28
- EMA 9 of MACD
- 0.09
- MACD histogram
- -0.36
- SMA 50
- $43.28
- Price below SMA 50
- EMA 50
- $43.00
- Price below EMA 50
- SMA 200
- $40.05
- Price above SMA 200
- EMA 200
- $40.17
- Price above EMA 200
Calculated by Gotrade from daily closing prices, as of November 20, 2026. Technical data, not a recommendation.
Analyst views
3 analyst ratings
Third-party analyst opinion, not a recommendation from Gotrade.
- Low
- $42.00
- Average
- $46.00
- High
- $53.00
Seasonality
Monthly price change (%)| Jan | Feb | Mar | Apr | May | Jun | Jul | Aug | Sep | Oct | Nov | Dec | |
|---|---|---|---|---|---|---|---|---|---|---|---|---|
| 2021 | -5.6 | +8.9 | ||||||||||
| 2022 | +3.0 | -4.3 | +15.6 | -15.9 | +18.7 | -0.9 | +7.9 | +3.9 | -15.5 | +3.5 | +2.8 | -9.0 |
| 2023 | +6.7 | -6.5 | +0.3 | -1.4 | -3.9 | +2.3 | +0.4 | -2.3 | -2.3 | +0.3 | +2.8 | -3.1 |
| 2024 | -3.4 | -0.0 | +3.3 | +2.4 | +2.7 | -0.5 | +3.7 | +2.7 | +1.3 | +4.5 | +3.5 | -9.3 |
| 2025 | +1.1 | +1.0 | -0.9 | +0.9 | -0.9 | -1.9 | -1.8 | +6.4 | +1.5 | -5.3 | +3.1 | -4.6 |
| 2026 | +5.3 | +9.8 | -7.1 | +1.8 | -2.8 | +6.1 | +3.6 | +3.6 | +3.6 | +4.9 | -6.4 |