
Metallus Inc. (MTUS) Stock
Key stats
- Market cap
- $650.24M
- Price / Earnings ratio
- 31.0x
- EPS (TTM)
- $0.57
- Volume
- Loading
- 52-week high
- $22.58
- 52-week low
- $14.19
Source: third-party data provider, as of November 7, 2026
Compare with MTUS
Recent news

What Metallus (MTUS) Said on Its Q3 Earnings Call
What Metallus (MTUS) Said on Its Q3 Earnings Call
MTUS
Metallus (MTUS) Beats Q3 Earnings Estimates
Metallus (MTUS) Beats Q3 Earnings Estimates
MTUS
Metallus Q2 Earnings Call Highlights
Metallus Q2 Earnings Call Highlights
MTUS
Metallus (MTUS) Matches Q2 Earnings Estimates
Metallus (MTUS) Matches Q2 Earnings Estimates
MTUSNews tone: automated (AI) classification of the article's content, not a price prediction.
Technical indicators
- RSI 14
- 23.87
- MACD 12/26/9
- -0.34
- EMA 9 of MACD
- 0.13
- MACD histogram
- -0.47
- SMA 50
- $19.73
- Price below SMA 50
- EMA 50
- $19.91
- Price below EMA 50
- SMA 200
- $19.12
- Price below SMA 200
- EMA 200
- $19.07
- Price below EMA 200
Calculated by Gotrade from daily closing prices, as of November 5, 2026. Technical data, not a recommendation.
Analyst ratings
No analyst data available
Financials
Performance
Debt & Balance Sheet
Revenue to Profit
2025Earnings
No data available
Source: third-party data provider
Latest news
What Metallus (MTUS) Said on Its Q3 Earnings Call
What Metallus (MTUS) Said on Its Q3 Earnings Call
MTUSMetallus (MTUS) Beats Q3 Earnings Estimates
Metallus (MTUS) Beats Q3 Earnings Estimates
MTUSMetallus Q2 Earnings Call Highlights
Metallus Q2 Earnings Call Highlights
MTUSMetallus (MTUS) Matches Q2 Earnings Estimates
Metallus (MTUS) Matches Q2 Earnings Estimates
MTUS
MTUS vs. NWPX: Which Stock Is the Better Value Option?
MTUS vs. NWPX: Which Stock Is the Better Value Option?
MTUS
MTUS or NWPX: Which Is the Better Value Stock Right Now?
MTUS or NWPX: Which Is the Better Value Stock Right Now?
MTUS
Are You Looking for a Top Momentum Pick? Why Metallus (MTUS) is a Great Choice
Are You Looking for a Top Momentum Pick? Why Metallus (MTUS) is a Great Choice
MTUS
Metallus (MTUS) Is Attractively Priced Despite Fast-paced Momentum
Metallus (MTUS) Is Attractively Priced Despite Fast-paced Momentum
MTUS
Metallus (MTUS) Shows Fast-paced Momentum But Is Still a Bargain Stock
Metallus (MTUS) Shows Fast-paced Momentum But Is Still a Bargain Stock
MTUS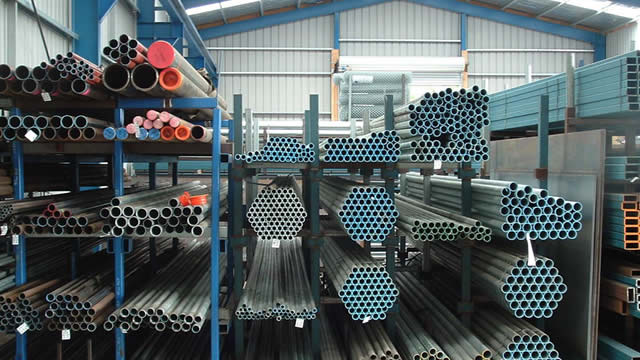
MTUS vs. NWPX: Which Stock Is the Better Value Option?
MTUS vs. NWPX: Which Stock Is the Better Value Option?
MTUSNews tone: automated (AI) classification of the article's content, not a price prediction.
About Metallus Inc.
Metallus Inc is an American-based manufacturer of alloy steel, as well as carbon and micro-alloy steel. The portfolio of the company includes special bar quality steel, seamless mechanical tubes, and value-added solutions, such as precision steel components. The company also supplies machining and thermal treatment services and manages raw material recycling programs that work as a feeder system for its melt operations. The company's products and services are used in the following sectors: oil and gas; automotive, industrial equipment; mining; construction; rail; aerospace and defense; heavy truck; agriculture and power generation. Geographically, the company mainly serves customers in the United States.
Key Executives
| Name | Title | Year Born |
|---|---|---|
| Mr. Michael S. Williams B.Sc. | CEO & Director | 1960 |
| Mr. Kristopher R. Westbrooks C.P.A. | President & COO | 1978 |
| Mr. John M. Zaranec III | Executive VP & CFO | 1982 |
| Ms. Kristine C. Syrvalin | Executive VP, General Counsel & Chief Human Resources Officer | 1969 |
| Mr. Kevin A. Raketich | Executive Vice President, Strategy and Corporate Development | 1967 |
| Mr. Nicholas A. Yacobozzi | Corporate Controller, Chief Accounting Officer & Principal Accounting Officer | 1986 |
| Ms. Jennifer K. Beeman | Director of Communications & Investor Relations | — |
Fundamentals
Valuation
Profitability
Trading
Dividend
Source: third-party data provider, as of November 7, 2026
Technical indicators
- RSI 14
- 23.87
- MACD 12/26/9
- -0.34
- EMA 9 of MACD
- 0.13
- MACD histogram
- -0.47
- SMA 50
- $19.73
- Price below SMA 50
- EMA 50
- $19.91
- Price below EMA 50
- SMA 200
- $19.12
- Price below SMA 200
- EMA 200
- $19.07
- Price below EMA 200
Calculated by Gotrade from daily closing prices, as of November 5, 2026. Technical data, not a recommendation.
Analyst views
No analyst data available
Seasonality
Monthly price change (%)| Jan | Feb | Mar | Apr | May | Jun | Jul | Aug | Sep | Oct | Nov | Dec | |
|---|---|---|---|---|---|---|---|---|---|---|---|---|
| 2026 | -3.2 | +17.2 | +2.7 | -4.4 | +11.6 | -4.5 | +0.6 | +8.8 | -26.1 |