Nova Measuring Instruments Ltd. (NVMI) Stock
Fundamentals
Compare with NVMI
Recent news
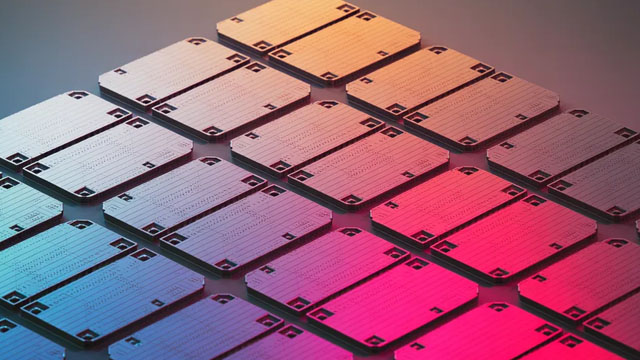
3 Chip Stocks Set to Win TSMC's Packaging Boom
3 Chip Stocks Set to Win TSMC's Packaging Boom
NVMI
AMKR vs. NVMI: Which Stock Is the Better Value Option?
AMKR vs. NVMI: Which Stock Is the Better Value Option?
NVMI
Should You Invest in NVMI Stock Following Healthy Q2 Results?
Should You Invest in NVMI Stock Following Healthy Q2 Results?
NVMI
Nova Ltd. (NVMI) Upgraded to Strong Buy: Here's Why
Nova Ltd. (NVMI) Upgraded to Strong Buy: Here's Why
NVMINews tone: automated (AI) classification of the article's content, not a price prediction.
Technical indicators
- RSI 14
- 60.34
- MACD 12/26/9
- 4.39
- EMA 9 of MACD
- -1.07
- MACD histogram
- 5.46
- SMA 50
- $376.73
- Price above SMA 50
- EMA 50
- $388.76
- Price above EMA 50
- SMA 200
- $443.87
- Price below SMA 200
- EMA 200
- $407.99
- Price below EMA 200
Calculated by Gotrade from daily closing prices, as of October 6, 2026. Technical data, not a recommendation.
Analyst ratings
Analyst consensus: Buy
Based on 4 analysts
Third-party analyst opinion, not a recommendation from Gotrade.
Financials
Performance
No data available
Debt & Balance Sheet
No data available
Revenue to Profit
No data available
Earnings
No data available
Latest news
3 Chip Stocks Set to Win TSMC's Packaging Boom
3 Chip Stocks Set to Win TSMC's Packaging Boom
NVMIAMKR vs. NVMI: Which Stock Is the Better Value Option?
AMKR vs. NVMI: Which Stock Is the Better Value Option?
NVMIShould You Invest in NVMI Stock Following Healthy Q2 Results?
Should You Invest in NVMI Stock Following Healthy Q2 Results?
NVMINova Ltd. (NVMI) Upgraded to Strong Buy: Here's Why
Nova Ltd. (NVMI) Upgraded to Strong Buy: Here's Why
NVMI
Nova Q2 Earnings Call Highlights
Nova Q2 Earnings Call Highlights
NVMI
Nova Ltd. (NVMI) Tops Q2 Earnings and Revenue Estimates
Nova Ltd. (NVMI) Tops Q2 Earnings and Revenue Estimates
NVMI
Nova Ltd. (NVMI) Soars 7.4%: Is Further Upside Left in the Stock?
Nova Ltd. (NVMI) Soars 7.4%: Is Further Upside Left in the Stock?
NVMI
Down 27% in 4 Weeks, Here's Why Nova Ltd. (NVMI) Looks Ripe for a Turnaround
Down 27% in 4 Weeks, Here's Why Nova Ltd. (NVMI) Looks Ripe for a Turnaround
NVMI
Onto Innovation vs. Nova: Which Chip Inspection Stock Has More Upside?
Onto Innovation vs. Nova: Which Chip Inspection Stock Has More Upside?
NVMI
S&P 500 Stocks Lead Five AI Plays Near Buy Points
S&P 500 Stocks Lead Five AI Plays Near Buy Points
NVMINews tone: automated (AI) classification of the article's content, not a price prediction.
About Nova Measuring Instruments Ltd.
Nova Ltd is a provider of metrology and process control solutions used in semiconductor manufacturing. The company provides high-performance metrology solutions across the semiconductor fabrication lifecycle and develops differentiated inline metrology solutions deployed by a broad range of customers, including integrated circuit manufacturers. Its portfolio combines high-precision hardware and software, enabling customers to improve device performance, enhance yields, and accelerate time to market. Its products include Dimensional Metrology, Materials Metrology, Chemical Metrology, and Software Solutions. The company operates in China, Taiwan, R.O.C., the United States and other regions, with maximum revenue coming from China.
Key Executives
| Name | Title | Year Born |
|---|---|---|
| Mr. Eitan Oppenhaim | Executive Chairman of the Board | 1966 |
| Mr. Gabriel Waisman | President & CEO | 1971 |
| Mr. Gabi Sharon | Chief Operating Officer | 1962 |
| Dr. Shay Wolfling | Chief Technology Officer | 1972 |
| Mr. Guy Kizner | Chief Financial Officer | 1984 |
| Mr. C. Thomas Larson | Vice President of Corporate Development | — |
| Ms. Orly Ben-Hamu-Lahav | Chief Marketing & Strategy Officer | — |
| Ms. Sharon Dayan | Chief Human Resources Officer | 1973 |
| Mr. Zohar Gil | Chief Business Officer | 1967 |
| Mr. Adrian S. Wilson | President of Nova Measuring Instruments, Inc & GM of Material Metrology Division | 1972 |
Fundamentals
Valuation
Earnings Per Share
Income Statement
Dividend
Technical indicators
- RSI 14
- 60.34
- MACD 12/26/9
- 4.39
- EMA 9 of MACD
- -1.07
- MACD histogram
- 5.46
- SMA 50
- $376.73
- Price above SMA 50
- EMA 50
- $388.76
- Price above EMA 50
- SMA 200
- $443.87
- Price below SMA 200
- EMA 200
- $407.99
- Price below EMA 200
Calculated by Gotrade from daily closing prices, as of October 6, 2026. Technical data, not a recommendation.
Analyst views
4 analyst ratings
Third-party analyst opinion, not a recommendation from Gotrade.
- Low
- $475.00
- Average
- $523.75
- High
- $570.00
Seasonality
Monthly price change (%)| Jan | Feb | Mar | Apr | May | Jun | Jul | Aug | Sep | Oct | Nov | Dec | |
|---|---|---|---|---|---|---|---|---|---|---|---|---|
| 2021 | +11.8 | +15.6 | +13.4 | |||||||||
| 2022 | -19.6 | -9.8 | +3.3 | -8.0 | +6.7 | -17.2 | +26.2 | -5.8 | -12.8 | -15.8 | +14.8 | -5.6 |
| 2023 | +9.4 | -4.7 | +14.1 | -11.2 | +19.0 | +5.7 | +8.1 | +2.0 | -12.0 | -13.6 | +32.1 | +7.3 |
| 2024 | +6.8 | +19.6 | -3.4 | -4.6 | +24.7 | +10.1 | +1.3 | |||||
| 2026 | -5.6 | -22.2 | -11.5 | +14.1 | +2.0 |