
Serve Robotics Inc. Common Stock (SERV) Stock
Key stats
- Market cap
- $277.13M
- Price / Earnings ratio
- -1.3x
- EPS (TTM)
- -$2.61
- Volume
- Loading
- 52-week high
- $16.08
- 52-week low
- $2.26
Source: third-party data provider, as of November 13, 2026
Compare with SERV
Recent news
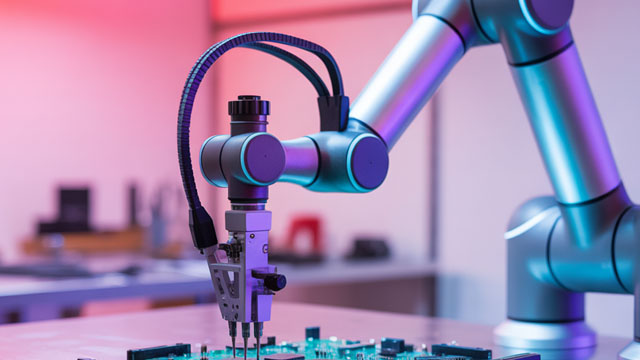
Analysts Estimate Serve Robotics Inc. (SERV) to Report a Decline in Earnings: What to Look Out for
Analysts Estimate Serve Robotics Inc. (SERV) to Report a Decline in Earnings: What to Look Out for
SERV
Serve Robotics Should Only Be Considered by Investors With a High Risk Tolerance
Serve Robotics Should Only Be Considered by Investors With a High Risk Tolerance
SERV
Why Serve Robotics Stock Plunged This Week
Why Serve Robotics Stock Plunged This Week
SERV
Dan Ives Thinks AI Buildout Still In Early Stages, With NVDA, MSFT, PLTR, AAPL And CRWD As Top AI Picks
Dan Ives Thinks AI Buildout Still In Early Stages, With NVDA, MSFT, PLTR, AAPL And CRWD As Top AI Picks
SERVNews tone: automated (AI) classification of the article's content, not a price prediction.
Technical indicators
- RSI 14
- 48.05
- MACD 12/26/9
- -0.25
- EMA 9 of MACD
- -0.36
- MACD histogram
- 0.11
- SMA 50
- $3.86
- Price below SMA 50
- EMA 50
- $3.75
- Price below EMA 50
- SMA 200
- $6.84
- Price below SMA 200
- EMA 200
- $6.80
- Price below EMA 200
Calculated by Gotrade from daily closing prices, as of November 11, 2026. Technical data, not a recommendation.
Analyst ratings
Analyst consensus: Buy
Based on 3 analyst ratings
Third-party analyst opinion, not a recommendation from Gotrade.
Financials
Performance
Debt & Balance Sheet
Revenue to Profit
2025Earnings
No data available
Source: third-party data provider
Latest news
Analysts Estimate Serve Robotics Inc. (SERV) to Report a Decline in Earnings: What to Look Out for
Analysts Estimate Serve Robotics Inc. (SERV) to Report a Decline in Earnings: What to Look Out for
SERVServe Robotics Should Only Be Considered by Investors With a High Risk Tolerance
Serve Robotics Should Only Be Considered by Investors With a High Risk Tolerance
SERVWhy Serve Robotics Stock Plunged This Week
Why Serve Robotics Stock Plunged This Week
SERVDan Ives Thinks AI Buildout Still In Early Stages, With NVDA, MSFT, PLTR, AAPL And CRWD As Top AI Picks
Dan Ives Thinks AI Buildout Still In Early Stages, With NVDA, MSFT, PLTR, AAPL And CRWD As Top AI Picks
SERV
SERV Cuts 2026 Revenue Outlook: Can Cost Discipline Limit the Impact?
SERV Cuts 2026 Revenue Outlook: Can Cost Discipline Limit the Impact?
SERV
Serve Robotics vs. Symbotic: Which Robotics Stock Has the Edge Now?
Serve Robotics vs. Symbotic: Which Robotics Stock Has the Edge Now?
SERV
Serve Robotics Targets a $450B Market: How Big Is Its Growth Runway?
Serve Robotics Targets a $450B Market: How Big Is Its Growth Runway?
SERV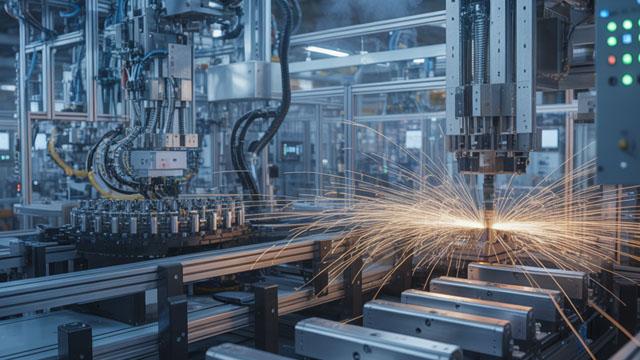
Can Serve Robotics' Beacon Overcome Restaurant Integration Barriers?
Can Serve Robotics' Beacon Overcome Restaurant Integration Barriers?
SERV
Can SERV's Revenue Diversification Offset Weaker Uber Deliveries?
Can SERV's Revenue Diversification Offset Weaker Uber Deliveries?
SERV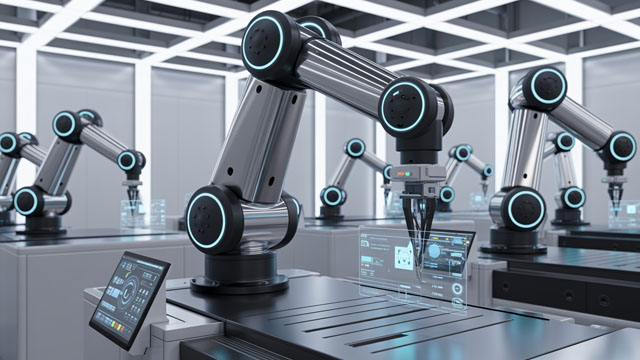
Serve Robotics Stock Slides 55% YTD: Should You Buy the Dip or Wait?
Serve Robotics Stock Slides 55% YTD: Should You Buy the Dip or Wait?
SERVNews tone: automated (AI) classification of the article's content, not a price prediction.
About Serve Robotics Inc. Common Stock
No description available.
Key Executives
| Name | Title | Year Born |
|---|---|---|
| Dr. Ali Kashani Ph.D. | Co-Founder, Chairman, CEO, Treasurer & Secretary | 1985 |
| Mr. Touraj Parang J.D. | President, COO & Director | 1973 |
| Mr. Brian Read | Chief Financial Officer | 1990 |
| Ms. MJ Burk Chun | Co-Founder and VP of Product & Design | 1978 |
| Mr. Dmitry Demeshchuk | Co-Founder & VP of Software | 1989 |
| Mr. Evan Dunn | General Counsel | — |
| Mr. Steve Webb | Senior Vice President of Marketing & Communications | — |
| Mr. Euan Abraham | Chief Hardware & Manufacturing Officer | 1977 |
| Mr. Prahar Shah | Chief Revenue Officer | 1985 |
| Mr. Anthony Armenta | Chief Software & Data Officer | — |
Fundamentals
Valuation
Profitability
Trading
Source: third-party data provider, as of November 13, 2026
Technical indicators
- RSI 14
- 48.05
- MACD 12/26/9
- -0.25
- EMA 9 of MACD
- -0.36
- MACD histogram
- 0.11
- SMA 50
- $3.86
- Price below SMA 50
- EMA 50
- $3.75
- Price below EMA 50
- SMA 200
- $6.84
- Price below SMA 200
- EMA 200
- $6.80
- Price below EMA 200
Calculated by Gotrade from daily closing prices, as of November 11, 2026. Technical data, not a recommendation.
Analyst views
3 analyst ratings
Third-party analyst opinion, not a recommendation from Gotrade.
- Low
- $3.22
- Average
- $8.27
- High
- $13.60
Seasonality
Monthly price change (%)| Jan | Feb | Mar | Apr | May | Jun | Jul | Aug | Sep | Oct | Nov | Dec | |
|---|---|---|---|---|---|---|---|---|---|---|---|---|
| 2024 | -14.5 | +6.3 | -30.4 | +803.1 | -50.8 | +10.6 | +26.8 | -13.3 | +47.5 | |||
| 2025 | +12.4 | -42.9 | -31.3 | +8.8 | +88.1 | -4.2 | -6.5 | +10.9 | +13.0 | +12.4 | -20.5 | +6.7 |
| 2026 | -11.8 | -3.3 | -15.6 | +12.1 | -0.5 | -30.1 | -26.8 | -13.8 | -0.9 | -45.3 | +26.3 |










