Sprouts Farmers Market, Inc. Common Stock (SFM) Stock
Key stats
- Market cap
- $4.66B
- Price / Earnings ratio
- 9.1x
- EPS (TTM)
- $5.25
- Volume
- Loading
- 52-week high
- $94.89
- 52-week low
- $47.35
Source: third-party data provider, as of November 13, 2026
Compare with SFM
Recent news

Michael Burry Re-Enters LULU On Weakness, Boosts Positions In MercadoLibre, PayPal, JD And More
Michael Burry Re-Enters LULU On Weakness, Boosts Positions In MercadoLibre, PayPal, JD And More
SFMMichael Burry Sees Nvidia Becoming ‘A Heck Of A Trade’ — Reveals His 2 Biggest Bets And Where He’s Buying More
Michael Burry Sees Nvidia Becoming ‘A Heck Of A Trade’ — Reveals His 2 Biggest Bets And Where He’s Buying More
SFM
US Stock Futures Fall As AMZN, INTC Earnings Trigger Tech Sell-Off: NVDA, RDDT, RIVN, SFM In Focus
US Stock Futures Fall As AMZN, INTC Earnings Trigger Tech Sell-Off: NVDA, RDDT, RIVN, SFM In Focus
SFM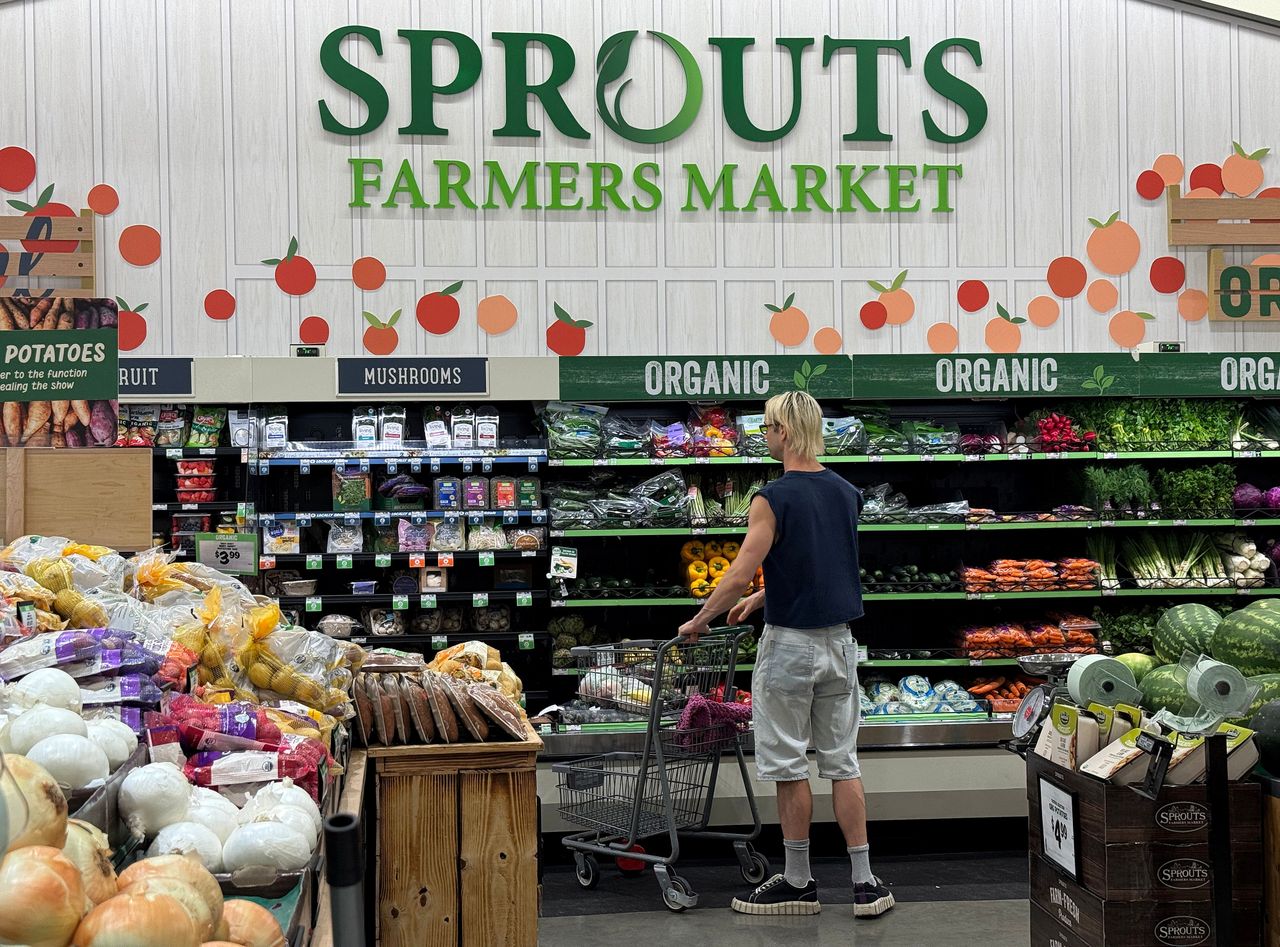
SFM Stock Heads For Worst Week Ever: Sprouts Farmers Market Faces Wall Street’s Ire As Analysts Slash Price Targets On Weak Outlook
SFM Stock Heads For Worst Week Ever: Sprouts Farmers Market Faces Wall Street’s Ire As Analysts Slash Price Targets On Weak Outlook
SFMTechnical indicators
- RSI 14
- 36.30
- MACD 12/26/9
- -4.73
- EMA 9 of MACD
- -4.13
- MACD histogram
- -0.60
- SMA 50
- $64.61
- Price below SMA 50
- EMA 50
- $63.49
- Price below EMA 50
- SMA 200
- $75.40
- Price below SMA 200
- EMA 200
- $73.07
- Price below EMA 200
Calculated by Gotrade from daily closing prices, as of November 11, 2026. Technical data, not a recommendation.
Analyst ratings
Analyst consensus: Buy
Based on 8 analyst ratings
Third-party analyst opinion, not a recommendation from Gotrade.
Financials
Performance
Debt & Balance Sheet
Revenue to Profit
2025Earnings
The market is expecting earnings per share of $1.32 for this quarter. The company has not yet shared when it is announcing earnings.
Source: third-party data provider
Latest news
Michael Burry Re-Enters LULU On Weakness, Boosts Positions In MercadoLibre, PayPal, JD And More
Michael Burry Re-Enters LULU On Weakness, Boosts Positions In MercadoLibre, PayPal, JD And More
SFMMichael Burry Sees Nvidia Becoming ‘A Heck Of A Trade’ — Reveals His 2 Biggest Bets And Where He’s Buying More
Michael Burry Sees Nvidia Becoming ‘A Heck Of A Trade’ — Reveals His 2 Biggest Bets And Where He’s Buying More
SFMUS Stock Futures Fall As AMZN, INTC Earnings Trigger Tech Sell-Off: NVDA, RDDT, RIVN, SFM In Focus
US Stock Futures Fall As AMZN, INTC Earnings Trigger Tech Sell-Off: NVDA, RDDT, RIVN, SFM In Focus
SFMSFM Stock Heads For Worst Week Ever: Sprouts Farmers Market Faces Wall Street’s Ire As Analysts Slash Price Targets On Weak Outlook
SFM Stock Heads For Worst Week Ever: Sprouts Farmers Market Faces Wall Street’s Ire As Analysts Slash Price Targets On Weak Outlook
SFM
SFM Q3 Earnings Miss Estimates on Soft Comps, Margin Pressure
SFM Q3 Earnings Miss Estimates on Soft Comps, Margin Pressure
SFM
Sprouts Farmers Market Q3 Earnings Call Highlights
Sprouts Farmers Market Q3 Earnings Call Highlights
SFM
Sprouts Farmers (SFM) Q3 Earnings: Taking a Look at Key Metrics Versus Estimates
Sprouts Farmers (SFM) Q3 Earnings: Taking a Look at Key Metrics Versus Estimates
SFM
Sprouts Farmers (SFM) Misses Q3 Earnings and Revenue Estimates
Sprouts Farmers (SFM) Misses Q3 Earnings and Revenue Estimates
SFM
Sprouts Farmers Market, Inc. Reports Third Quarter 2026 Results
Sprouts Farmers Market, Inc. Reports Third Quarter 2026 Results
SFM
Natural Food Stocks to Gain Momentum as Health Trends Drive Demand
Natural Food Stocks to Gain Momentum as Health Trends Drive Demand
SFMNews tone: automated (AI) classification of the article's content, not a price prediction.
About Sprouts Farmers Market, Inc. Common Stock
Sprouts Farmers Market Inc offers a specialty grocery experience featuring an open layout with fresh produce at the heart of the store. Sprouts inspire wellness naturally with a carefully curated assortment products paired with purpose-driven people. The company continues to bring products made with lifestyle-friendly ingredients such as organic, plant-based, and gluten-free. It approximately has 407 stores in nearly 23 states. The Company has one operating segment that is healthy grocery stores.
Key Executives
| Name | Title | Year Born |
|---|---|---|
| Mr. Jack L. Sinclair | CEO & Director | 1961 |
| Mr. Nicholas Konat | President & COO | 1978 |
| Mr. Curtis Valentine | Chief Financial Officer | 1980 |
| Mr. Stacy W. Hilgendorf | VP, Controller & Principal Accounting Officer | 1970 |
| Ms. Susannah Livingston | Vice President of Investor Relations & Treasury | — |
| Mr. Brandon F. Lombardi Esq., J.D. | Chief Legal & Sustainability Officer and Corporate Secretary | 1977 |
| Ms. Timmi Zalatoris | Chief Human Resources Officer | 1977 |
| Mr. David M. McGlinchey | Chief Development Officer | 1973 |
| Ms. Kim Coffin | Senior Vice President & Chief Forager | 1969 |
| Mr. Joseph Hurley | Chief Supply Chain Officer | 1968 |
Fundamentals
Valuation
Profitability
Trading
Source: third-party data provider, as of November 13, 2026
Technical indicators
- RSI 14
- 36.30
- MACD 12/26/9
- -4.73
- EMA 9 of MACD
- -4.13
- MACD histogram
- -0.60
- SMA 50
- $64.61
- Price below SMA 50
- EMA 50
- $63.49
- Price below EMA 50
- SMA 200
- $75.40
- Price below SMA 200
- EMA 200
- $73.07
- Price below EMA 200
Calculated by Gotrade from daily closing prices, as of November 11, 2026. Technical data, not a recommendation.
Analyst views
8 analyst ratings
Third-party analyst opinion, not a recommendation from Gotrade.
- Low
- $49.00
- Average
- $65.63
- High
- $95.00
Seasonality
Monthly price change (%)| Jan | Feb | Mar | Apr | May | Jun | Jul | Aug | Sep | Oct | Nov | Dec | |
|---|---|---|---|---|---|---|---|---|---|---|---|---|
| 2021 | +7.5 | +12.8 | ||||||||||
| 2022 | -8.8 | +5.0 | +12.6 | -8.1 | -10.5 | -5.3 | +7.5 | +4.9 | -4.6 | +6.3 | +19.5 | -5.1 |
| 2023 | +3.3 | -5.5 | +13.7 | -1.7 | -1.3 | +12.1 | +7.0 | +6.6 | +8.7 | +0.0 | +6.2 | +9.5 |
| 2024 | +2.7 | +21.0 | +1.7 | +3.8 | +22.8 | +6.1 | +19.5 | +3.3 | +10.8 | +15.7 | +18.6 | -15.8 |
| 2025 | +19.1 | -7.1 | +3.9 | +10.1 | +0.7 | -8.3 | -6.5 | -8.8 | -21.5 | -26.3 | -0.0 | -7.2 |
| 2026 | -12.1 | +6.2 | +4.2 | +7.9 | +1.8 | +6.1 | +0.5 | -7.6 | -17.9 | -22.9 | -8.5 |