South Bow Corporation (SOBO) Stock
Key stats
- Market cap
- $6.90B
- Price / Earnings ratio
- 14.7x
- EPS (TTM)
- $2.23
- Volume
- Loading
- 52-week high
- $39.02
- 52-week low
- $25.94
- Dividend yield
- 6.04%
- Dividend amount (latest)
- $0.50
Source: third-party data provider, as of November 13, 2026
Compare with SOBO
Recent news

Analysts Estimate South Bow Corporation (SOBO) to Report a Decline in Earnings: What to Look Out for
Analysts Estimate South Bow Corporation (SOBO) to Report a Decline in Earnings: What to Look Out for
SOBO
South Bow Corporation (SOBO) Upgraded to Buy: What Does It Mean for the Stock?
South Bow Corporation (SOBO) Upgraded to Buy: What Does It Mean for the Stock?
SOBO
South Bow Q2 Earnings Call Highlights
South Bow Q2 Earnings Call Highlights
SOBO
Compared to Estimates, South Bow Corporation (SOBO) Q2 Earnings: A Look at Key Metrics
Compared to Estimates, South Bow Corporation (SOBO) Q2 Earnings: A Look at Key Metrics
SOBONews tone: automated (AI) classification of the article's content, not a price prediction.
Technical indicators
- RSI 14
- 43.40
- MACD 12/26/9
- -0.57
- EMA 9 of MACD
- -0.32
- MACD histogram
- -0.25
- SMA 50
- $34.66
- Price below SMA 50
- EMA 50
- $34.59
- Price below EMA 50
- SMA 200
- $34.68
- Price below SMA 200
- EMA 200
- $33.51
- Price below EMA 200
Calculated by Gotrade from daily closing prices, as of November 11, 2026. Technical data, not a recommendation.
Analyst ratings
Analyst consensus: Sell
Based on 2 analyst ratings
Third-party analyst opinion, not a recommendation from Gotrade.
Financials
Performance
Debt & Balance Sheet
Revenue to Profit
2025Earnings
No data available
Source: third-party data provider
Latest news
Analysts Estimate South Bow Corporation (SOBO) to Report a Decline in Earnings: What to Look Out for
Analysts Estimate South Bow Corporation (SOBO) to Report a Decline in Earnings: What to Look Out for
SOBOSouth Bow Corporation (SOBO) Upgraded to Buy: What Does It Mean for the Stock?
South Bow Corporation (SOBO) Upgraded to Buy: What Does It Mean for the Stock?
SOBOSouth Bow Q2 Earnings Call Highlights
South Bow Q2 Earnings Call Highlights
SOBOCompared to Estimates, South Bow Corporation (SOBO) Q2 Earnings: A Look at Key Metrics
Compared to Estimates, South Bow Corporation (SOBO) Q2 Earnings: A Look at Key Metrics
SOBO
South Bow Corporation (SOBO) Earnings Expected to Grow: Should You Buy?
South Bow Corporation (SOBO) Earnings Expected to Grow: Should You Buy?
SOBO
South Bow targets 2027 decision on Canada-US oil pipeline revival
South Bow targets 2027 decision on Canada-US oil pipeline revival
SOBO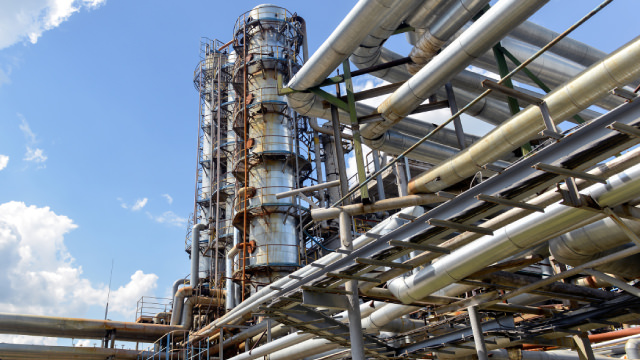
Canada's South Bow delays Keystone XL restart until US permit assured
Canada's South Bow delays Keystone XL restart until US permit assured
SOBO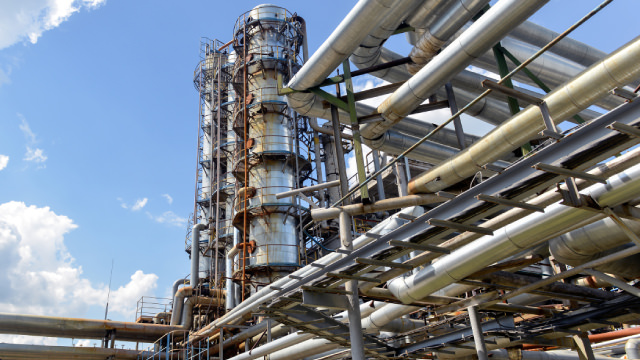
South Bow Q1 Earnings Call Highlights
South Bow Q1 Earnings Call Highlights
SOBO
South Bow working to secure required permitting for Canada-US oil pipeline proposal
South Bow working to secure required permitting for Canada-US oil pipeline proposal
SOBO
South Bow Corporation (SOBO) Q1 Earnings and Revenues Miss Estimates
South Bow Corporation (SOBO) Q1 Earnings and Revenues Miss Estimates
SOBONews tone: automated (AI) classification of the article's content, not a price prediction.
About South Bow Corporation
No description available.
Key Executives
| Name | Title | Year Born |
|---|---|---|
| Mr. Bevin Mark Wirzba M.B.A., P.Eng. | President, CEO & Director | 1972 |
| Mr. Richard J. Prior | Senior VP & COO | — |
| Ms. Lori M. Muratta | Senior VP & General Counsel | 1965 |
| Martha Wilmot | Director of Investor Relations | — |
| Ms. Kate Fischer | Associate General Counsel & Corporate Secretary | — |
Fundamentals
Valuation
Profitability
Trading
Dividend
Source: third-party data provider, as of November 13, 2026
Technical indicators
- RSI 14
- 43.40
- MACD 12/26/9
- -0.57
- EMA 9 of MACD
- -0.32
- MACD histogram
- -0.25
- SMA 50
- $34.66
- Price below SMA 50
- EMA 50
- $34.59
- Price below EMA 50
- SMA 200
- $34.68
- Price below SMA 200
- EMA 200
- $33.51
- Price below EMA 200
Calculated by Gotrade from daily closing prices, as of November 11, 2026. Technical data, not a recommendation.
Analyst views
2 analyst ratings
Third-party analyst opinion, not a recommendation from Gotrade.
- Low
- $34.00
- Average
- $34.50
- High
- $35.00
Seasonality
Monthly price change (%)| Jan | Feb | Mar | Apr | May | Jun | Jul | Aug | Sep | Oct | Nov | Dec | |
|---|---|---|---|---|---|---|---|---|---|---|---|---|
| 2024 | +6.0 | +5.4 | -5.0 | |||||||||
| 2025 | -0.4 | +12.4 | -3.2 | -3.3 | +4.4 | +0.0 | +2.3 | +5.3 | +3.0 | -7.3 | +7.6 | -0.6 |
| 2026 | +1.8 | +13.8 | +1.4 | +5.7 | +3.6 | -3.1 | +7.7 | +4.3 | -12.4 | +7.3 | -5.7 |