Thor Industries (THO) Stock
Key stats
- Market cap
- $3.43B
- Price / Earnings ratio
- 19.3x
- EPS (TTM)
- $0.22
- Volume
- Loading
- 52-week high
- $122.83
- 52-week low
- $62.83
- Dividend yield
- 2.94%
- Dividend amount (latest)
- $0.52
Source: third-party data provider, as of October 23, 2026
Compare with THO
Recent news

These 4 Companies Just Increased Their Dividends. Not All the Raises Are Equal
These 4 Companies Just Increased Their Dividends. Not All the Raises Are Equal
THO
Thor Industries Is Boring—And That May Be Its Biggest Advantage
Thor Industries Is Boring—And That May Be Its Biggest Advantage
THO
THO Q4 Earnings Miss Estimates on North American Margin Pressure
THO Q4 Earnings Miss Estimates on North American Margin Pressure
THO
Thor Industries (THO) Q4 Earnings: Taking a Look at Key Metrics Versus Estimates
Thor Industries (THO) Q4 Earnings: Taking a Look at Key Metrics Versus Estimates
THONews tone: automated (AI) classification of the article's content, not a price prediction.
Technical indicators
- RSI 14
- 54.70
- MACD 12/26/9
- -1.16
- EMA 9 of MACD
- -1.70
- MACD histogram
- 0.54
- SMA 50
- $72.09
- Price below SMA 50
- EMA 50
- $70.87
- Price below EMA 50
- SMA 200
- $82.85
- Price below SMA 200
- EMA 200
- $83.21
- Price below EMA 200
Calculated by Gotrade from daily closing prices, as of October 22, 2026. Technical data, not a recommendation.
Analyst ratings
Analyst consensus: Hold
Based on 5 analyst ratings
Third-party analyst opinion, not a recommendation from Gotrade.
Financials
Performance
Debt & Balance Sheet
Revenue to Profit
2026Earnings
The market is expecting earnings per share of $1.56 for this quarter. The company has not yet shared when it is announcing earnings.
Source: third-party data provider
Latest news
These 4 Companies Just Increased Their Dividends. Not All the Raises Are Equal
These 4 Companies Just Increased Their Dividends. Not All the Raises Are Equal
THOThor Industries Is Boring—And That May Be Its Biggest Advantage
Thor Industries Is Boring—And That May Be Its Biggest Advantage
THOTHO Q4 Earnings Miss Estimates on North American Margin Pressure
THO Q4 Earnings Miss Estimates on North American Margin Pressure
THOThor Industries (THO) Q4 Earnings: Taking a Look at Key Metrics Versus Estimates
Thor Industries (THO) Q4 Earnings: Taking a Look at Key Metrics Versus Estimates
THO
Thor Industries (THO) Q4 Earnings Lag Estimates
Thor Industries (THO) Q4 Earnings Lag Estimates
THO
What Analyst Projections for Key Metrics Reveal About Thor Industries (THO) Q4 Earnings
What Analyst Projections for Key Metrics Reveal About Thor Industries (THO) Q4 Earnings
THO
Thor Industries (THO) Expected to Beat Earnings Estimates: What to Know Ahead of Q4 Release
Thor Industries (THO) Expected to Beat Earnings Estimates: What to Know Ahead of Q4 Release
THO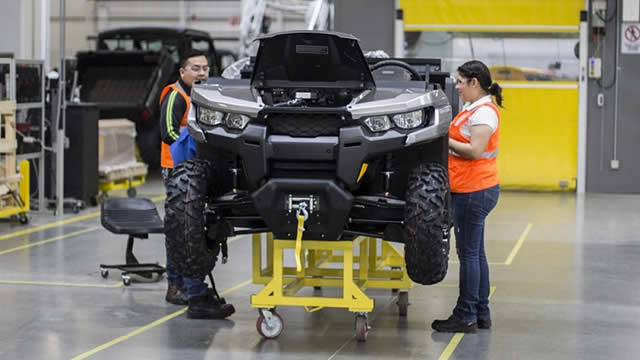
Should Value Investors Buy Thor Industries (THO) Stock?
Should Value Investors Buy Thor Industries (THO) Stock?
THO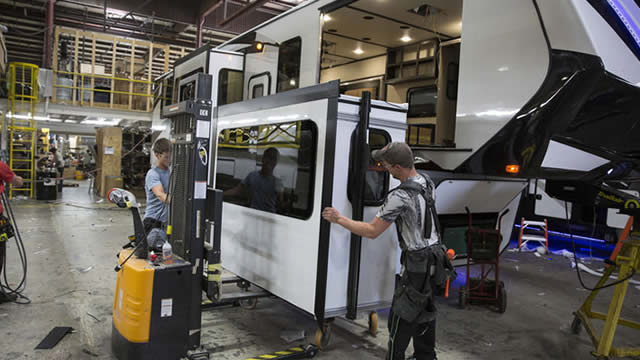
Here Is Why Bargain Hunters Would Love Fast-paced Mover Thor Industries (THO)
Here Is Why Bargain Hunters Would Love Fast-paced Mover Thor Industries (THO)
THO
Are Investors Undervaluing Thor Industries (THO) Right Now?
Are Investors Undervaluing Thor Industries (THO) Right Now?
THONews tone: automated (AI) classification of the article's content, not a price prediction.
About Thor Industries
Based in Elkhart, Indiana, Thor Industries manufactures Class A, Class B, and Class C motor homes along with travel trailers and fifth-wheel towables across about 35 brands. Through the acquisition of Erwin Hymer in 2019, the company expanded its geographic footprint and now produces various motorized and towable recreational vehicles for Europe, including motor caravans, camper vans, urban vehicles, caravans, and other RV-related products and services. The company has also begun generating revenue through aftermarket component parts via the acquisition of Airxcel in 2021; however, this is still a nascent part of the business as it accounts for less than 10% of fiscal 2025 total sales. In fiscal 2025, the company wholesaled 181,388 units and generated $9.6 billion in revenue.
Key Executives
| Name | Title | Year Born |
|---|---|---|
| Mr. Robert W. Martin | President, CEO & Director | 1969 |
| Ms. Colleen A. Zuhl CPA | Senior VP & CFO | 1966 |
| Mr. W. Todd Woelfer | Senior VP & COO | 1967 |
| Mr. Peter B. Orthwein | Co-Founder & Chairman Emeritus | 1945 |
| Mr. Trevor Q. Gasper J.D. | Senior VP, General Counsel & Secretary | 1981 |
| Ms. Michele L. McDermott | Senior VP & CHRO | 1971 |
| Mr. Ryan Biren | Chief Information Officer | — |
| Ms. Renee Jones | Vice President of Marketing | — |
| Mr. Troy James | President of Keystone | — |
| Mr. McKay Featherstone | Senior Vice President of Global Innovation | — |
Fundamentals
Valuation
Profitability
Trading
Dividend
Source: third-party data provider, as of October 23, 2026
Technical indicators
- RSI 14
- 54.70
- MACD 12/26/9
- -1.16
- EMA 9 of MACD
- -1.70
- MACD histogram
- 0.54
- SMA 50
- $72.09
- Price below SMA 50
- EMA 50
- $70.87
- Price below EMA 50
- SMA 200
- $82.85
- Price below SMA 200
- EMA 200
- $83.21
- Price below EMA 200
Calculated by Gotrade from daily closing prices, as of October 22, 2026. Technical data, not a recommendation.
Analyst views
5 analyst ratings
Third-party analyst opinion, not a recommendation from Gotrade.
- Low
- $70.00
- Average
- $83.60
- High
- $95.00
Seasonality
Monthly price change (%)| Jan | Feb | Mar | Apr | May | Jun | Jul | Aug | Sep | Oct | Nov | Dec | |
|---|---|---|---|---|---|---|---|---|---|---|---|---|
| 2021 | -0.8 | -0.5 | -1.5 | |||||||||
| 2022 | -9.6 | -6.0 | -13.7 | -2.7 | -5.5 | -0.4 | +10.5 | -3.9 | -11.6 | +16.9 | +3.7 | -13.4 |
| 2023 | +26.3 | -8.0 | -13.1 | +0.7 | -2.2 | +31.2 | +11.3 | -9.3 | -12.0 | -7.9 | +10.3 | +13.4 |
| 2024 | -3.8 | +10.2 | -9.1 | -14.4 | +1.1 | -5.5 | +15.3 | +6.4 | +4.4 | -5.6 | +6.7 | -13.7 |
| 2025 | +8.8 | -0.8 | -24.0 | -5.5 | +10.6 | +12.0 | +0.2 | +20.0 | -4.0 | +0.3 | +1.3 | -4.6 |
| 2026 | +6.1 | -14.9 | -16.5 | +1.5 | +1.2 | -3.3 | -0.2 | -1.9 | -7.1 | -3.8 |