
TOYO Co., Ltd Ordinary Shares (TOYO) Stock
Key stats
- Market cap
- $217.87M
- Price / Earnings ratio
- 2.6x
- EPS (TTM)
- $2.09
- Volume
- Loading
- 52-week high
- $17.43
- 52-week low
- $3.71
Source: third-party data provider, as of November 13, 2026
Compare with TOYO
Recent news
TOYO Targets U.S. Solar Cell Expansion as First-Half Revenue Soars 88%
TOYO Targets U.S. Solar Cell Expansion as First-Half Revenue Soars 88%
TOYO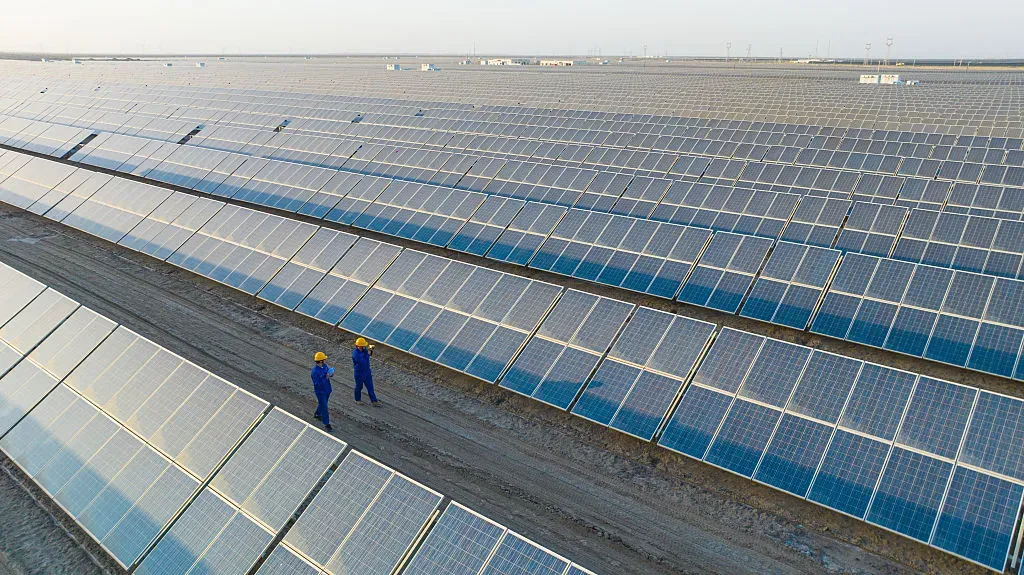
FSLR Stock Heads For Its Worst Week In Over A Month — Roth Says US Polysilicon Crackdown Could Provide A Tailwind
FSLR Stock Heads For Its Worst Week In Over A Month — Roth Says US Polysilicon Crackdown Could Provide A Tailwind
TOYO
TOYO Corporation Opens Its Quantum Computers to Japan's Ecosystem
TOYO Corporation Opens Its Quantum Computers to Japan's Ecosystem
TOYO
TOYO H1 Earnings Call Highlights
TOYO H1 Earnings Call Highlights
TOYONews tone: automated (AI) classification of the article's content, not a price prediction.
Technical indicators
- RSI 14
- 59.96
- MACD 12/26/9
- 0.24
- EMA 9 of MACD
- 0.14
- MACD histogram
- 0.10
- SMA 50
- $4.40
- Price above SMA 50
- EMA 50
- $4.73
- Price above EMA 50
- SMA 200
- $7.89
- Price below SMA 200
- EMA 200
- $6.81
- Price below EMA 200
Calculated by Gotrade from daily closing prices, as of November 11, 2026. Technical data, not a recommendation.
Analyst ratings
Analyst consensus: Buy
Based on 1 analyst rating
Third-party analyst opinion, not a recommendation from Gotrade.
Financials
Performance
Debt & Balance Sheet
Revenue to Profit
2025Earnings
No data available
Source: third-party data provider
Latest news
TOYO Targets U.S. Solar Cell Expansion as First-Half Revenue Soars 88%
TOYO Targets U.S. Solar Cell Expansion as First-Half Revenue Soars 88%
TOYOFSLR Stock Heads For Its Worst Week In Over A Month — Roth Says US Polysilicon Crackdown Could Provide A Tailwind
FSLR Stock Heads For Its Worst Week In Over A Month — Roth Says US Polysilicon Crackdown Could Provide A Tailwind
TOYOTOYO Corporation Opens Its Quantum Computers to Japan's Ecosystem
TOYO Corporation Opens Its Quantum Computers to Japan's Ecosystem
TOYOTOYO H1 Earnings Call Highlights
TOYO H1 Earnings Call Highlights
TOYO
TOYO Expands U.S. Solar Push With Houston HJT Plant and Non-FEOC Supply Chain
TOYO Expands U.S. Solar Push With Houston HJT Plant and Non-FEOC Supply Chain
TOYO
TOYO Stock Crashes More Than 37%, Cracks Below 200-DMA For The First Time In Nearly 13 Months – Retail Calls The Selloff An ‘Overkill’
TOYO Stock Crashes More Than 37%, Cracks Below 200-DMA For The First Time In Nearly 13 Months – Retail Calls The Selloff An ‘Overkill’
TOYO
TOYO Q1 Earnings Call Highlights
TOYO Q1 Earnings Call Highlights
TOYO
3 More Small-Cap Stocks to Buy
3 More Small-Cap Stocks to Buy
TOYO
3 Small-Cap Stocks to Buy Before May 15
3 Small-Cap Stocks to Buy Before May 15
TOYO
First Enterprise Quantum Computer Purchase in Japan: IQM to Deploy System to TOYO Corporation
First Enterprise Quantum Computer Purchase in Japan: IQM to Deploy System to TOYO Corporation
TOYONews tone: automated (AI) classification of the article's content, not a price prediction.
About TOYO Co., Ltd Ordinary Shares
Toyo Co Ltd, along with its subsidiaries, is engaged in research and development, production, and sales of solar cells and solar modules and related businesses. The company operates across the solar value chain, including upstream wafer and silicon manufacturing, midstream solar cell production, and downstream photovoltaic (PV) module production. It generated revenues from sales of solar cells, solar modules and provision of facilitation services. Geographically, the company derived the majority of the revenue from the USA.
Key Executives
| Name | Title | Year Born |
|---|---|---|
| Mr. Takahiko Onozuka | Chairman & CEO | 1961 |
| Mr. Harada Yasunari | CFO & Director | — |
| Mr. Liang Shi | President | 1979 |
| Dr. Aihua Wang Ph.D. | CTO & Director | 1953 |
| Mr. Junsei Ryu | Advisor | 1971 |
| Mr. Rhone A. Resch | Chief Strategy Officer | 1967 |
Fundamentals
Valuation
Profitability
Trading
Source: third-party data provider, as of November 13, 2026
Technical indicators
- RSI 14
- 59.96
- MACD 12/26/9
- 0.24
- EMA 9 of MACD
- 0.14
- MACD histogram
- 0.10
- SMA 50
- $4.40
- Price above SMA 50
- EMA 50
- $4.73
- Price above EMA 50
- SMA 200
- $7.89
- Price below SMA 200
- EMA 200
- $6.81
- Price below EMA 200
Calculated by Gotrade from daily closing prices, as of November 11, 2026. Technical data, not a recommendation.
Analyst views
1 analyst rating
Third-party analyst opinion, not a recommendation from Gotrade.
- Low
- $18.00
- Average
- $18.00
- High
- $18.00
Seasonality
Monthly price change (%)| Jan | Feb | Mar | Apr | May | Jun | Jul | Aug | Sep | Oct | Nov | Dec | |
|---|---|---|---|---|---|---|---|---|---|---|---|---|
| 2026 | -58.5 | -25.1 | -21.3 | +4.1 | +6.3 | +8.1 |










