TTM Technologies Inc (TTMI) Stock
Key stats
- Market cap
- $8.29B
- Price / Earnings ratio
- 28.3x
- EPS (TTM)
- $2.57
- Volume
- Loading
- 52-week high
- $223.83
- 52-week low
- $55.44
Source: third-party data provider, as of November 13, 2026
Compare with TTMI
Recent news
TTMI Q3 Earnings Call Highlights AI Demand and Expansion Plans
TTMI Q3 Earnings Call Highlights AI Demand and Expansion Plans
TTMI
Here is Why Growth Investors Should Buy TTM (TTMI) Now
Here is Why Growth Investors Should Buy TTM (TTMI) Now
TTMI
Here's Why TTM Technologies (TTMI) is a Strong Growth Stock
Here's Why TTM Technologies (TTMI) is a Strong Growth Stock
TTMI
TTMI vs. AXTI: Which AI Infrastructure Stock Is the Better Pick?
TTMI vs. AXTI: Which AI Infrastructure Stock Is the Better Pick?
TTMINews tone: automated (AI) classification of the article's content, not a price prediction.
Technical indicators
- RSI 14
- 43.32
- MACD 12/26/9
- -10.47
- EMA 9 of MACD
- -10.77
- MACD histogram
- 0.30
- SMA 50
- $106.43
- Price below SMA 50
- EMA 50
- $101.23
- Price below EMA 50
- SMA 200
- $127.21
- Price below SMA 200
- EMA 200
- $113.09
- Price below EMA 200
Calculated by Gotrade from daily closing prices, as of November 11, 2026. Technical data, not a recommendation.
Analyst ratings
Analyst consensus: Buy
Based on 3 analyst ratings
Third-party analyst opinion, not a recommendation from Gotrade.
Financials
Performance
Debt & Balance Sheet
Revenue to Profit
2025Earnings
The market is expecting earnings per share of $0.67 for this quarter. The company has not yet shared when it is announcing earnings.
Source: third-party data provider
Latest news
TTMI Q3 Earnings Call Highlights AI Demand and Expansion Plans
TTMI Q3 Earnings Call Highlights AI Demand and Expansion Plans
TTMIHere is Why Growth Investors Should Buy TTM (TTMI) Now
Here is Why Growth Investors Should Buy TTM (TTMI) Now
TTMIHere's Why TTM Technologies (TTMI) is a Strong Growth Stock
Here's Why TTM Technologies (TTMI) is a Strong Growth Stock
TTMITTMI vs. AXTI: Which AI Infrastructure Stock Is the Better Pick?
TTMI vs. AXTI: Which AI Infrastructure Stock Is the Better Pick?
TTMI
TTMI Investors with $100,000 in Losses Have Opportunity to Join TTM Technologies, Inc. Fraud Investigation with SBS Law
TTMI Investors with $100,000 in Losses Have Opportunity to Join TTM Technologies, Inc. Fraud Investigation with SBS Law
TTMI
TTMI Q3 Earnings & Revenues Surpass Estimates, Both Surge Y/Y
TTMI Q3 Earnings & Revenues Surpass Estimates, Both Surge Y/Y
TTMI
Why TTM Technologies Stock Plunged This Week
Why TTM Technologies Stock Plunged This Week
TTMI
TTM Technologies: 3 Key Takeaways for Long-Term Investors
TTM Technologies: 3 Key Takeaways for Long-Term Investors
TTMI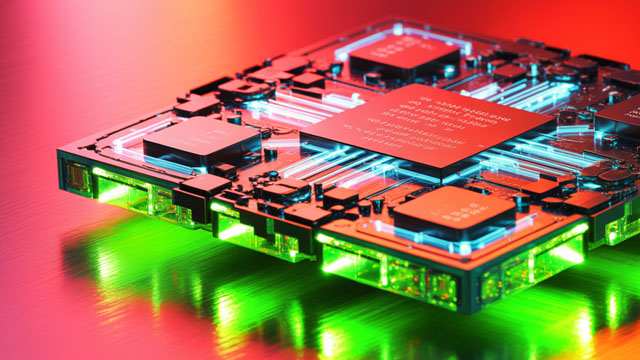
Why TTM Technologies Stock Jumped Plunged 30% Today
Why TTM Technologies Stock Jumped Plunged 30% Today
TTMI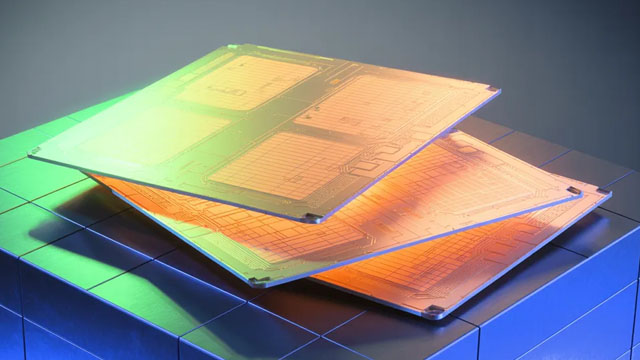
TTM Technologies Q3 Earnings Call Highlights
TTM Technologies Q3 Earnings Call Highlights
TTMINews tone: automated (AI) classification of the article's content, not a price prediction.
About TTM Technologies Inc
TTM Technologies Inc manufactures technology solutions, including mission systems, radio frequency (RF) components/RF microwave/microelectronic assemblies, quick-turn and technologically printed circuit boards (PCB). The company is based in the United States and derives roughly half of its revenue domestically. It organizes itself into two segments: printed circuit boards and RF&S Components. The printed circuit boards segment, which contributes the majority of revenue, offers a range of printed circuit boards as well as layout design and simulation, and testing services. TTM Technologies' products are used in manufacturing, networking, telecommunications, computing, aerospace, and medical fields.
Key Executives
| Name | Title | Year Born |
|---|---|---|
| Dr. Edwin Roks B.Sc., M.Sc., Ph.D. | President, CEO & Director | 1965 |
| Mr. Daniel L. Boehle CPA | Executive VP & CFO | 1973 |
| Mr. James P. Walsh | Executive VP & COO | — |
| Mr. Douglas L. Soder | Executive VP & President of Commercial Sector | 1961 |
| Ms. Catherine A. Gridley | Executive VP and President of Aerospace & Defense (A&D) Sector | 1969 |
| Ms. Elizabeth Romo | Chief Accounting Officer | 1977 |
| Mr. Anthony Joseph Sandeen | Senior Vice President of AMI&I & Global Sales | 1967 |
| Mr. Shawn Powers | Executive VP & Chief Human Resources Officer | 1974 |
| Mr. Thomas Clapprood | President of Radar Systems & Sensors BU for TTM Technologies Aerospace & Defense Bus. Sector | 1970 |
| Mr. Jeffrey S. Jankowsky | President of C4ISR + Space Business Unit | 1960 |
Fundamentals
Valuation
Profitability
Trading
Source: third-party data provider, as of November 13, 2026
Technical indicators
- RSI 14
- 43.32
- MACD 12/26/9
- -10.47
- EMA 9 of MACD
- -10.77
- MACD histogram
- 0.30
- SMA 50
- $106.43
- Price below SMA 50
- EMA 50
- $101.23
- Price below EMA 50
- SMA 200
- $127.21
- Price below SMA 200
- EMA 200
- $113.09
- Price below EMA 200
Calculated by Gotrade from daily closing prices, as of November 11, 2026. Technical data, not a recommendation.
Analyst views
3 analyst ratings
Third-party analyst opinion, not a recommendation from Gotrade.
- Low
- $150.00
- Average
- $161.67
- High
- $170.00
Seasonality
Monthly price change (%)| Jan | Feb | Mar | Apr | May | Jun | Jul | Aug | Sep | Oct | Nov | Dec | |
|---|---|---|---|---|---|---|---|---|---|---|---|---|
| 2021 | -3.8 | +7.9 | ||||||||||
| 2022 | -11.1 | -7.6 | +19.5 | -5.5 | +2.1 | -12.3 | +11.2 | +14.8 | -13.7 | +12.0 | +4.6 | -6.0 |
| 2023 | +4.0 | -17.6 | -0.1 | -11.0 | +15.7 | +3.7 | +3.5 | +3.7 | -13.4 | -11.1 | +16.2 | +5.5 |
| 2024 | -10.6 | +3.7 | +3.8 | -1.9 | +25.9 | +4.0 | +1.7 | -0.5 | +0.7 | +23.0 | +10.4 | -0.5 |
| 2025 | +0.0 | -1.0 | -10.6 | -3.3 | +27.9 | +36.8 | +16.3 | +2.8 | +28.1 | +13.8 | +0.4 | +1.6 |
| 2026 | +39.1 | +1.4 | -13.8 | +63.0 | +9.3 | +8.5 | -35.8 | -1.9 | +6.5 | -34.4 | +2.8 |