Investors often think of interest rates behaving all the same way, in reality those rates differ depending on their maturity dates, this is where a yield curve comes in, as a visual graphic representation of bond yields across different maturity.
A yield curve can play a big part in your return on investment and it can also be used as a tool to analyze the economic direction. This article will cover everything you need to know about the yield curve and give you an idea of what it means for someone who owns US stocks rather than bonds.
What Is the Yield Curve?
The yield curve is a visual graph of bond interest rates that differ by the maturity dates but still have the same credit quality, the slope on yield curve predict the direction of interest rates alongside the economic expansion or contraction, but this curve is not some sort of forecast, it is the accumulation of what buyers and sellers were willing to accept on that day. This curve is published on the US Department of Treasury's website every trading day.
The yield curve published by the US Department of Treasury currently is the benchmark for other yield curves worldwide. The US bonds become a reference point to determine dollar borrowing costs, this includes self funded bonds.
How Does the Yield Curve Work?
The yield curve works by showing the price periodically, each point reflected as a lender's demand for return in that time period, the gap between each point is what the market expects to happen.
1. What a bond yield actually is
A bond yield is a ratio in percentage that measures the annual return paid by bonds based on its current price. When a lot of buyers purchase a bond, their prices will increase and because the bond's annual payment is fixed, the yield on the higher price will fall.
2. Which yields get plotted
Each day, the U.S. Department of the Treasury publishes constant maturity Treasury rates covering the par yield curve for various tenors; according to the Federal Reserve's H.15 report, this data is obtained by reading the curve at fixed maturity points.
3. What moves each end of the curve
Short-term yields track central bank policy and near-term rate expectations, while long-term yields reflect multi-year projections for economic growth, inflation, and term risk. Ultimately, the yield curve's slope measures the gap between where policy rates are today and where the market expects rates and the economy heads to.
What Are the Main Types of Yield Curves?
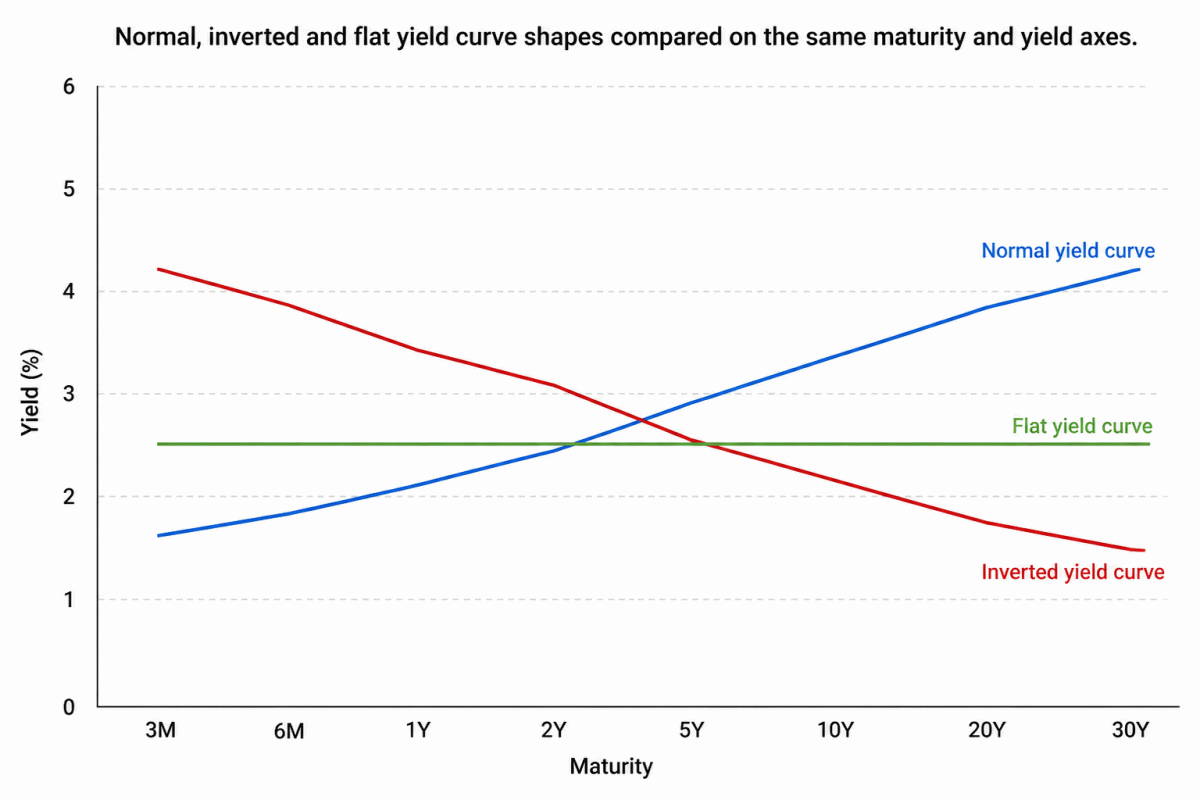
The yield curves come in three main shapes, plus one variant worth naming.
Shape | What it looks like | What it usually reflects | Historical association |
Normal | Upward sloping, long yields above short | Expectation of steady or rising rates and growth | The ordinary state, most of the time |
Inverted | Downward sloping, short yields above long | Expectation that rates will be cut from here | Has preceded US recessions |
Flat | Roughly the same yield across maturities | Uncertainty, or a curve in transition | Often a stage between normal and inverted |
Humped | Middle maturities yield more than both ends | A specific squeeze in medium-term expectations | Uncommon, often a transitional stage |
1. The normal yield curve
The normal yield curve is the most common shape and the easiest to understand which is why it is called normal, it slopes upward with a longer maturity date and pays more than the shorter ones.
2. The inverted yield curve
This shape , marked by the downward slopes where the return on short-term yields is above the long-term ones.
This curve displayed as the downward slopes where the return on short-term yields is higher than the long-term. This indicates an expected interest rate cut which means the market expects rates to be lower in future, which will be discussed more in this article.
3. Flat and humped curves
A flat curve pays roughly the same interest rate across maturities, so the compensation for time has disappeared, this curve often shows up between the other two curves, as a curve moves from normal toward inverted or back. Then there is a humped curve, where medium maturities out-yield both ends, is less common and usually transitional too.
What Does the US Yield Curve Look Like in 2026?
The latest US Treasury curve is upward sloping as per September 2026, check it gradually as these rates change every business day.
Maturity | Yield |
1 month | 3.73% |
3 months | 3.74% |
6 months | 3.79% |
1 year | 3.80% |
2 years | 3.88% |
3 years | 3.90% |
5 years | 4.01% |
7 years | 4.20% |
10 years | 4.39% |
20 years | 4.97% |
30 years | 4.96% |
Source: US Department of the Treasury, Daily Par Yield Curve Rates, early September 2026.
This yield curve rate shows a normal curve in numbers with the 2 spread; 10-year minus 2-year sits at 0.51 percentage points, and the 10-year minus 3-month at 0.65.
One detail runs the other way. The 30-year yields 4.96 percent against 4.97 on the 20-year, a fraction lower. Small inversions at the very long end are not unusual and do not make the curve inverted.
What Does an Inverted Yield Curve Signal About Recessions?
An inverted yield curve has historically preceded US recessions, Research by Bauer and Mertens at the Federal Reserve Bank of San Francisco found that every US recession over the last 60 years was preceded by a negative term spread making it the most watched recession indicator in financial markets.
The same research found that a negative term spread was always followed by an economic slowdown, but only in most cases by an actual recession. There has been at least one occasion where the signal fired and no recession followed.
What Is Riding the Yield Curve?
Riding the yield curve or rolling down the curve, is a bond investment strategy. It buys longer maturity bonds and sells them before the maturity date aiming to take profit as the bond moves into a lower-yielding part of the curve. This strategy requires a stable upward-sloping curve.
Let's take an example from the September 2026 numbers. A 5-year bond yields 4.01 percent. Hold it for two years and it becomes a 3-year bond that yields 3.90 percent. This means the bond has rolled down the curve with a lower yield and a higher price, selling the bond at this point realizes that price gain plus the interest already received. This strategy is mostly used by bond desks and fund managers rather than individual investors.
Here is the simulation for the riding the yield curve.
How Does the Yield Curve Affect Stock Investors?
Aside from enabling investors to use the yield curve to make economic predictions that influence their investment decisions, the yield curve also affects equity investors in three ways: borrowing costs, sectoral impacts, and the returns available from cash.
1. Borrowing costs and company earnings
A company issuing 10-year debt pays the 10-year bond yield plus a spread as its own credit risk. When the long end of the yield curve shifts upward, the cost of rolling over existing debt increases across the broader market. Companies with higher debt-to-equity ratios absorb these elevated refinancing costs much faster than their less-leveraged counterparts.
As for retail investors, heavily indebted stocks directly weakens the net income and equity valuations and can carry dividend risk and sharp price adjustment in the market.
2. Sector effects
The usual suspect is the bank sector because it touches their core business directly, banks usually borrow short and lend long which causes steep curves and widens the gap on their earnings.
While start-ups and other growing companies depend on their expected profit annually in the future which makes them more sensitive to long yields than companies earning most of their cash today. Reading a company's earnings report alongside rate conditions will give a fuller picture than either alone.
3. The competition from cash
Stocks have to offer a better return to attract investors when the short-term cash earns a risk free 4% return, this is the concept that mostly new investors miss. Bond yield does not just track one financial instrument, it is as a benchmark that other assets must overcome.
Conclusion
The yield curve refers to current bond market conditions and does not guarantee a specific outcome, for stock investors its important to understand its value as a signal to be considered alongside with other factors as this numbers are published daily.
Gotrade gives access to US stocks through fractional shares, from $1. Open a Gotrade account to follow how these rate conditions play out across the companies you hold.
This content is for educational purposes only and is not investment advice or a recommendation. Investing carries risk, including the possible loss of principal.




