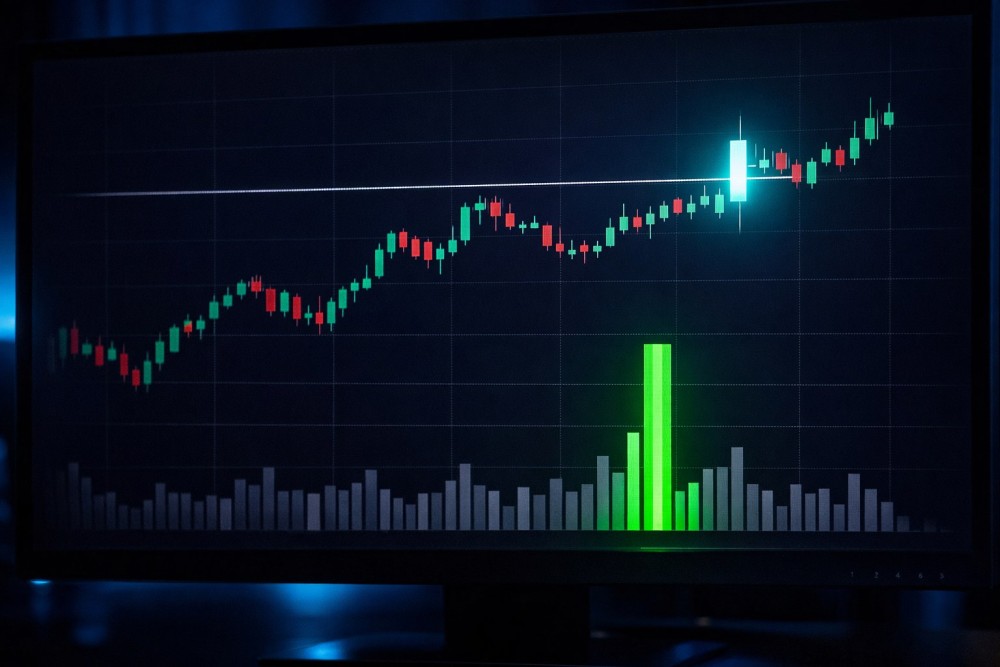
Volume is the quiet signal behind every clean breakout, and most retail traders still ignore it.
Price tells you where a stock is going. Volume tells you whether anyone of size actually agrees.
If you only watch candles, you will keep buying fakeouts. If you add a volume overlay to your chart, the picture changes fast.
Why Volume Is the Most Underrated Technical Indicator
Volume measures how many shares change hands during a bar. It is the rawest measure of conviction in any market.
A breakout on weak volume is just a price tick. One on volume two or three times the recent average is a behavioral shift.
Most setups fail because the trader confirms entries on price alone. A simple volume bar under the chart filters out many false signals.
For broader context, see our guide to mastering technical analysis.
Breakout vs Fakeout: Volume as the Differentiator
A real breakout closes above resistance with a volume spike well above the 20-day average. Institutional buyers leave fingerprints, and those fingerprints look like volume.
A fakeout pushes through resistance briefly, then rolls back inside the range on thin volume. Without participation, there is no follow-through.
The simplest filter is a 1.5x rule. If breakout-bar volume is at least 1.5 times the 20-day average, the move has a far better chance of holding through the next session.
Want to test these ideas on your own watchlist? Open your Gotrade chart tools and add a volume overlay to your top three tickers before the next session.
On-Balance Volume (OBV) and Volume-Weighted Average Price (VWAP)
Two indicators turn raw volume into actionable lines on your chart. Both are free on every serious charting platform.
On-balance volume (OBV)
OBV adds the day's volume on up days and subtracts it on down days, giving you a running cumulative line. According to Fidelity Learning Center, when both price and OBV make higher peaks and higher troughs together, the upward trend is likely to continue.
Divergence is where OBV earns its keep. If price grinds to a new high but OBV refuses to follow, distribution is happening underneath, and the breakout is suspect.
Volume-weighted average price (VWAP)
VWAP plots the average price weighted by volume from the open. It is the benchmark institutional desks use to grade their own fills intraday.
For breakout traders, VWAP acts as dynamic support during a strong session. A clean reclaim of VWAP on rising volume often marks the moment a stock transitions from chop to trend.
Case Study: Volume Confirmation on Nvidia (NVDA) and Tesla (TSLA)
Theory only matters if it survives real charts. Two of the most-traded US names show both sides of the volume story.
Nvidia (NVDA) breakout walkthrough
When Nvidia (NVDA) cleared its prior swing high after a multi-week base, breakout-bar volume printed roughly two and a half times its 20-day average. OBV pushed to a fresh high in the same session, confirming accumulation.
The follow-through bar held above the breakout level on still-elevated volume. That is the textbook sequence: spike, hold, continuation.
Tesla (TSLA) breakout walkthrough
By contrast, Tesla (TSLA) has produced multiple resistance pierces on flat or declining OBV. Each time, price reversed inside two sessions and trapped breakout buyers.
The lesson is not that TSLA cannot break out. It is that without volume confirmation, even a high-beta favorite is just guessing.
Combining Volume With Moving Averages and RSI
Volume is strongest when it agrees with trend and momentum tools you already use. Stacking confirmations is how professional setups are built.
The cleanest pattern: price reclaims the 50-day moving average, RSI crosses back above 50, and breakout volume runs at least 1.5x the 20-day average. All three lights green is rare, and that is exactly why it works.
According to StockCharts ChartSchool, OBV can be used to confirm a price trend, an upside breakout, or a downside break, which is why it pairs naturally with moving-average crossovers.
If you trade across multiple horizons, our explainer on multi-timeframe analysis shows how to align volume on the daily with entries on the hourly.
Common Mistakes: Ignoring Pre-Market Volume and Earnings Distortion
Pre-market volume gives you a read on overnight conviction before the regular session opens. Skipping it means walking into the bell blind.
Earnings days break the rules. Volume on an earnings reaction is almost always elevated, so the 1.5x filter loses its meaning for that single bar.
Treat earnings sessions as a separate regime. Re-anchor your 20-day average and your breakout thresholds two or three sessions after the report, not before.
Conclusion
Volume turns a price chart from a guessing game into a structured read on real participation. OBV, VWAP, and a simple 1.5x average filter are enough to start.
Pull up your watchlist, add a volume overlay, and re-grade your last five entries against the rules above. Review your chart setup inside Gotrade and start trading breakouts that the market actually agrees with.
FAQ
What volume multiple confirms a real breakout?
A breakout bar trading at 1.5 to 2 times the 20-day average volume is generally considered confirmed.
Is OBV better than VWAP for breakout trading?
OBV works best for swing setups across days, while VWAP is the sharper tool for intraday breakout entries.
Does pre-market volume actually matter for US stocks?
Yes, elevated pre-market volume often predicts whether the regular-session breakout will hold or fail.
How does earnings season distort volume signals?
Earnings reactions push volume far above normal, so standard breakout filters should be paused for one to two sessions.
Can I rely on volume alone to enter a trade?
No, volume is a confirmation tool and works best alongside trend, support and resistance, and momentum indicators like RSI.