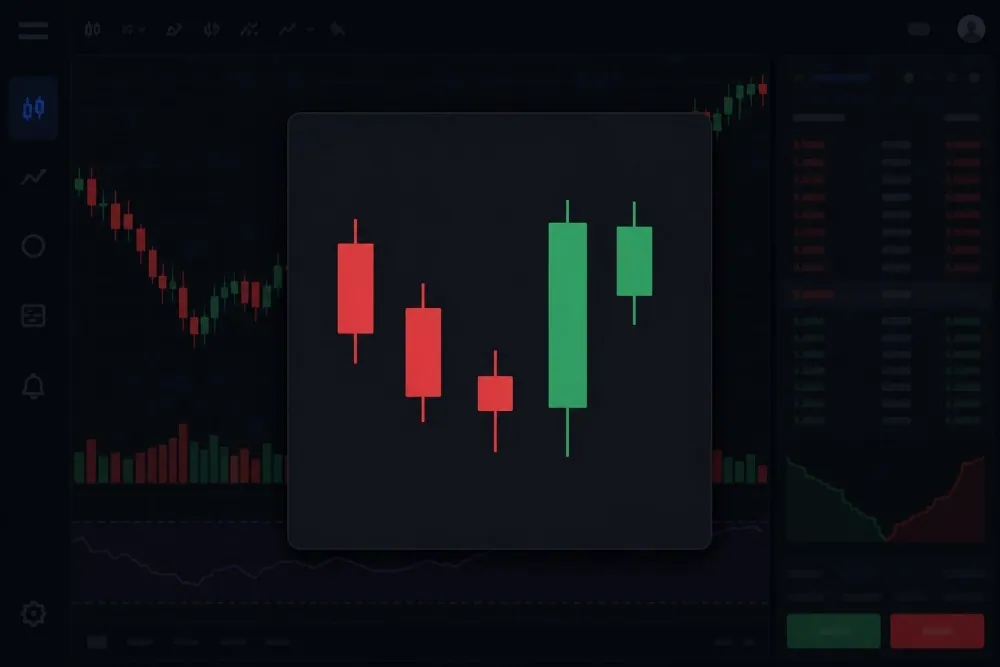
A candlestick pattern is a shape made by one or more candles, and each candle records one period's open, high, low and close
The body spans the open to the close, and the wicks mark the high and the low.
A shape alone is not a signal.
Candlesticks work best as context, not as a forecast.
Candlestick patterns are shapes, consisting of one or more candles on a price chart. Traders read candlestick patterns as indicators, on what might be going on between buyers and sellers of a particular asset. These patterns describe what has already happened with past trades, and investors use them to predict future patterns.
In order to decide if a pattern means anything, an investor would need multiple context. Investors may want to look at the trend before it, the price level where a pattern started, and the trade volume.
This guide will discuss how to read a single candle, and what to check to run before interpreting any pattern. We will take a look at 19 patterns, what confirms and what disproves each pattern, as well as a quiz to top it off.
This article is for educational purpose only, not investment advice. Please note that past patterns do not guarantee future results.
What is a candlestick?
A candlestick is a shape that sums up one period (it could be from one minute to one month) of an asset being traded. A candle consists of lines reflecting four prices: the opening price, the high, the low, and the closing price. On a daily chart, the opening is where the day began, and the closing price is where the day ended.
The first ever recorded (and academically published) use of candlestick chart has been traced back to 18th-century Japanese rice markets, with the trader Munehisa Homma as the usual attribution. Steve Nison later brought the method to Western traders.
In short, a green candle means the asset closes above its open, and a red candle means it closes below the opening price. The wicks in the middle always indicate the high and low of that period.
Body, wicks and colour
Although it might look a little complicated, a candlestick is pretty simple. The body of the candle shows the price range between opening time, and the closing. A long body means a big gap, big price change.
The wicks (also called shadows) are the thin lines above and below it, and it marks the highest and the lowest price point reached during the period. Take a look at this diagram:
Candlestick anatomy diagram
Now, you can see that there are already several things to observe from candlesticks:
Color: a green (or hollow) candle closed above its open; a red or filled candle closed below it. CAUTION: different platform can show different colors, so check with your source.
Long vs short bodies: a long body shows "conviction", because one side firmly controlled the move from open to close. A short body shows "hesitation", since there is little movement from open to close.
Long upper wick: price climbed but was pushed back down, so we can conclude that higher prices were rejected.
Long lower wick: price dropped but was pulled back up.
Candle as a "tug of war"
Let's say, for example, a daily candle that opens at 50.00, falls to 47.00, then recovers and close at 49.80. Assume the high was the open (this is a hypothetical example).
An investor can read it this way: sellers pushed price down 3.00 during the day, and then buyers took back 2.80 of that by the close. The body is tiny (0.20, a slight loss), but the long lower wick tells the real story: sellers pushed hard and buyers took most of it back. This might be an important information for investors, since it portrays behaviors from both sides.
This tug-of-war model is reused in every pattern entry below. The main questions when looking at each pattern stays the same: always ask who pushed, who pushed back, and who was holding the rope at the closing time.
Four things to check when reading patterns
A candle shape on its own is not strong enough to be trusted as a signal. Investors will check these four things (in this particular order) to test their hypothesis on a pattern. One most important rule before all these: always wait for the candle to close. Every pattern we discuss in this article is judged on closed candles only.
Is there a trend to reverse? A bullish reversal needs a prior decline, while a bearish reversal needs a prior advance. With no trend, there is nothing to reverse.
Where did it form? Near a prior support or resistance level, or a swing high or low, a pattern carries more weight. In the middle of a range, price has no particular reason to turn.
Support and resistance are price levels on a chart where a market tends to pause or reverse, so check or horizontal levels where price turned around two or more times.
Did volume back it? Check whether the key candle, or the follow-through, traded on above-average volume. Heavier volume suggests more participants agreed with the move.
Did the next one to three sessions confirm it, and where would it be proven wrong? Confirmation means price moves the way the pattern suggested. Invalidation means price moves back beyond the pattern's high or low (for a bullish pattern, a close below its low; for a bearish one, a close above its high). Decide that level before you act, not after.
An investor may ignore a pattern that fails the first two checks. Failing these checks usually means the "pattern" has little context supporting it. Sometimes, it doesn't matter how much the shape matches our "textbook shapes", if it doesn't have the right factors.
Single-candle patterns
Before we jump into these patterns, remember that single candles are the weakest signals on their own. One session cannot show a trend (or confirmation), so treat each of these candle only as a signal to look at the next candle.
We will discuss every type of candles using the same five lines: shape, buyers vs sellers position, where it matters, what confirms it, and what disproves it.
Doji
Shape: the open and close are equal or almost equal, leaving little body (or sometimes none). There are few variants: standard (wicks on both sides), long-legged (long wicks on both sides), dragonfly (long lower wick, no upper wick) and gravestone (long upper wick, no lower wick).
Buyers and sellers: a "draw" between the two, and the price landed just where it started. On a dragonfly, sellers pushed down and buyers recovered all of it. On a gravestone, buyers pushed up and sellers erased it.
Where it matters: after an extended move or at a key level (support/resistance). By itself, Doji is neutral.
Confirmation: a next candle that closes in the new direction, such as a close above the doji's high after a decline or below its low after an advance.
Disproval: price carrying on in the old direction past the doji's extreme.
Spinning top
Shape: a small body with wicks above and below, usually longer than the body. It differs from a doji only by body size: a spinning top has a small but visible body, a doji almost none.
Buyers and sellers: a session where neither side won. Both pushed, and neither held the ground.
Where it matters: after a strong run, where it can hint that momentum is slowing, or at a key level.
Confirmation: if the next candle closes decisively in one direction.
Disproval: if the next candle is long, in the direction of the earlier trend.
Marubozu
Shape: a full body with little or no wick.
Buyers and sellers: one side took the whole session, from open to close.
Where it matters: it is read as strength or weakness, but not a reversal yet (not on its own). Marubozu has the strongest effect when it breaks through a key level, on strong volume.
Confirmation: a follow-through, with the next candle continuing the trend.
Disproval: a close back beyond the marubozu's open, which negates the whole move.
Hammer and hanging man
These two are seen as bullish and bearish sign respectively. Both have a small body near the top of the range and a long lower wick, with the general consensus that they must be "at least twice" the body length. It's called a hammer if it comes after a decline, and people call it "hanging man" if it comes after an advance.
Hammer (after a decline)
Shape: small body near the top, lower wick at least twice the body, little or no upper wick.
Buyers and sellers: sellers drove price sharply lower, then buyers pushed it back and closed near the high.
Where it matters: after a decline, near support or a prior swing low.
Confirmation: the next session closes above the hammer's high.
Disproval: a close below the hammer's low.
Hanging man (after an advance)
Shape: the same.
Buyers and sellers: sellers showed up and pushed price down hard during the session. Buyers recovered by the close, but the first sign of selling pressure has appeared.
Where it matters: after an advance, near resistance or a swing high.
Confirmation: the next session closes below the hanging man's body, ideally on higher volume.
Disproval: a close above its high.
Inverted hammer and shooting star
Both have a small body near the bottom of the range and a long upper wick, with little or no lower wick.
Inverted hammer (after a decline)
Shape: small body near the bottom, long upper wick.
Buyers and sellers: buyers tried to lift price and were pushed back, but sellers also failed to close it at the lows.
Where it matters: after a decline, near support or a swing low.
Confirmation: bullish follow-through.
Disproval: a close below its low.
Shooting star (after an advance)
Shape: the same small body near the bottom and long upper wick.
Buyers and sellers: buyers pushed to a new high and sellers rejected it, closing price back near the open.
Where it matters: after an advance, near resistance or a swing high.
Confirmation: the next candle closes below the star's body or low.
Disproval: a close above the star's high.
Two-candle patterns
Here are common two candle patterns, representing two sessions. These patterns may tell a more complete story.
Bullish and bearish engulfing
A bullish engulfing pattern is a small down candle, after a decline, followed by an up candle. The body of the up candle must cover the previous candle's body.
Bullish engulfing (after a decline)
Shape: a small red candle, then a green candle whose body opens at or below the first close and closes at or above the first open.
Buyers and sellers: sellers were in control, then buyers took over, so much that they erased the previous candle's whole body.
Where it matters: after a decline, near support or a swing low.
Confirmation: the next session closes above the engulfing candle's close.
Disproval: a close below the pattern's low.
Bearish engulfing (after an advance)
Shape: a small green candle, then a red candle that opens at or above the first close and closes at or below the first open.
Buyers and sellers: buyers were in control, then sellers took over and erased the previous body.
Where it matters: after an advance, near resistance or a swing high, with a large second body and heavy volume.
Confirmation: the next session closes below the engulfing candle's close.
Disproval: a close above the pattern's high.
Bullish and bearish harami
Harami means "pregnant" in Japanese. This shape is a small body that sits inside the previous large body, and the geometry is the reverse of engulfing. A harami shows a fading momentum, but nobody has taken control yet.
Bullish harami (after a decline)
Shape: a large red candle, then a small candle (often green, sometimes a doji) whose body sits inside the first body.
Buyers and sellers: sellers lost momentum. Buyers have not taken over; they have only stopped the drop.
Where it matters: after a decline, near support or a swing low.
Confirmation: a next candle that closes above the small candle's high, and more convincingly above the large candle's high.
Disproval: a close below the pattern's low.
Bearish harami (after an advance)
This pattern tells you the advance has lost steam, not that sellers have arrived, so it needs confirmation before it means much.
Shape: a large green candle, then a small candle whose body sits inside the first body.
Buyers and sellers: buying momentum faded, and sellers have not yet taken over.
Where it matters: after an advance, near resistance or a swing high.
Confirmation: a next candle that closes below the small candle's low, and more convincingly below the large candle's low.
Disproval: a close above the pattern's high.
Piercing line and dark cloud cover
In both patterns, the second candle opens beyond the prior close and closes past the midpoint of the first body, without fully engulfing it.
Pay attention to the midpoint in these patterns. The midpoint matters because it splits the first session's move in half. If the second candle is closing past the previous midpoint, it means the new side has recovered more than half of what the other side gained, so the earlier momentum has been significantly countered. Closing short of it looks more like a pause.
Piercing line (after a decline)
Shape: a long red candle, then a green candle that opens below the first close and closes above the midpoint of the first body, but below its open.
Buyers and sellers: sellers still had the opening, but buyers took back more than half of the prior session's drop.
Where it matters: after a decline, near support or a swing low.
Confirmation: the next candle closes above the piercing candle's high.
Disproval: a close below the pattern's low.
Dark cloud cover (after an advance)
Shape: a long green candle, then a red candle that opens above the first close and closes below the midpoint of the first body, but above its open.
Buyers and sellers: buyers still had the opening, but sellers took back more than half of the prior session's gain.
Where it matters: after an advance, near resistance or a swing high.
Confirmation: the next candle closes below the dark cloud candle's low.
Disproval: a close above the pattern's high.
Three-candle patterns
Three-candle patterns are rarer than one-candle and two-candle shapes, but the confirmation is stronger since it's built inside the pattern itself.
Morning star and evening star
A morning star shows how the control moves from sellers to buyers. On day one, a long red candle confirms the downtrend. On day two, a small-bodied candle (called 'the star') shows that selling pressure is in a standstill. On day three, a long green candle finally closes into the first body, confirming that the buyers have taken back a large part of it.
Morning star (after a decline)
Shape: a long red candle, a small-bodied star of either color, then a long green candle closing into the first body.
Buyers and sellers: sellers dominate, then hesitate, then buyers take over.
Where it matters: after a decline, near support or a swing low, with the third candle on higher volume.
Confirmation: the third candle itself is a confirmation.
Disproval: if the third candle closes below the star's low.
Evening star (after an advance)
This is the mirror image of a morning star pattern.
Shape: a long green candle, a small-bodied star, then a long red candle closing well into the first body.
Buyers and sellers: buyers dominate, then hesitate, then sellers take over.
Where it matters: after an advance, near resistance or a swing high.
Confirmation: the third candle itself.
Disproval: a close above the star's high.
Three white soldiers and three black crows
Both patterns are three long candles in a row, each opening within the prior body and closing near its extreme. They show pressure building steadily on one side for three sessions.
Caution: After a long run, three big candles can mark an over-extended move rather than the start of a new movement. This could happen if some late buyers (or sellers) are chasing a move that has already happened.
Three white soldiers (after a decline or a base)
Shape: three consecutive long green candles, each opening within the previous body and closing near its high, each close above the last.
Buyers and sellers: buyers pressed higher three sessions running, and sellers could not push price back.
Where it matters: after a decline or a sideways base, ideally breaking through a resistance level. After a long advance, treat it with more suspicion.
Confirmation: a fourth session that holds near the highs, with volume staying healthy.
Disproval: a close back below the first candle's open, which erases the run.
Three black crows (after an advance)
Shape: three consecutive long red candles, each opening within the previous body and closing near its low, each close below the last.
Buyers and sellers: sellers pressed lower three sessions running, and buyers could not lift price back.
Where it matters: after an advance, near resistance or a swing high. After a long decline, much of the selling may already be done.
Confirmation: a fourth session that stays near the lows.
Disproval: a close back above the first candle's open.
Continuation patterns
There are two classic continuation patterns: the rising three, and the falling three methods. These are a long candle, followed by a few small counter-trend candles inside its range, followed again by a long candle that resumes the first trend.
These patterns happen when there is a pushback from buyers or sellers against the trend, but not strong enough to break it into reversal.
Rising three methods (in an uptrend)
Shape: a long green candle, then three small red (or mixed) candles that stay inside the first candle's high-low range, then a long green candle closing above the first candle's close.
Buyers and sellers: sellers pushed back for a few sessions but could not break the first candle's range, and buyers then resumed control.
Where it matters: inside an established uptrend, ideally with the small candles on lighter volume and the final candle on heavier volume.
Confirmation: the final long candle closing above the first candle's close, and a next session that holds above it.
Disproval: a close below the first candle's low, which means the pause turned into a reversal.
Falling three methods (in a downtrend)
Shape: a long red candle, then three small green (or mixed) candles that stay inside the first candle's range, then a long red candle closing below the first candle's close.
Buyers and sellers: buyers bounced for a few sessions but could not break the first candle's range, and sellers then resumed control.
Where it matters: inside an established downtrend, with the final candle on heavier volume.
Confirmation: the final long candle closing below the first candle's close, and a next session that stays below it.
Disproval: a close above the first candle's high.
You can see visual examples of all the 19 patterns here:
Candlestick patterns: confirmed or proven wrong
Candlestick Patterns Summary
Pattern
Candles
Prior trend
What it suggests
Typical confirmation
Disproval
Indecision and strength
Doji
1
An extended move helps
Stalemate; neutral by itself
Next close beyond the doji's high or low in the new direction
Close past the doji's extreme in the old direction
Spinning top
1
A strong run helps
Neither side won
A decisive close in one direction
A long candle in the earlier trend's direction
Marubozu
1
None required
One side controlled the session
Next candle holds the marubozu's midpoint
Close back beyond the marubozu's open
Bullish reversals
Hammer
1
Decline
Lower prices rejected
Next close above the hammer's high
Close below the hammer's low
Inverted hammer
1
Decline
Possible buyer interest
Next close above its high
Close below its low
Bullish engulfing
2
Decline
Buyers took over
Next close above the engulfing candle's close
Close below the pattern's low
Bullish harami
2
Decline
Selling momentum fading
Close above the small candle's high, better above the large candle's high
Close below the pattern's low
Piercing line
2
Decline
Buyers took back over half the drop
Next close above the piercing candle's high
Close below the pattern's low
Morning star
3
Decline
Control passing to buyers
The third candle, then a hold above the star's high
Close below the star's low
Three white soldiers
3
Decline or base
Sustained buying
Fourth session holds near the highs
Close below the first candle's open
Bearish reversals
Hanging man
1
Advance
First sign of selling pressure
Next close below its body
Close above its high
Shooting star
1
Advance
Higher prices rejected
Next close below the star's body or low
Close above its high
Bearish engulfing
2
Advance
Sellers took over
Next close below the engulfing candle's close
Close above the pattern's high
Bearish harami
2
Advance
Buying momentum fading
Close below the small candle's low, better below the large candle's low
Close above the pattern's high
Dark cloud cover
2
Advance
Sellers took back over half the gain
Next close below the dark cloud candle's low
Close above the pattern's high
Evening star
3
Advance
Control passing to sellers
The third candle, then a hold below the star's low
Close above the star's high
Three black crows
3
Advance
Sustained selling
Fourth session stays near the lows
Close above the first candle's open
Continuation
Rising three methods
5
Uptrend
Uptrend pausing, not turning
Final candle closes above the first candle's close
Close below the first candle's low
Falling three methods
5
Downtrend
Downtrend pausing, not turning
Final candle closes below the first candle's close
Close above the first candle's high
Candlestick Pattern Quiz
You can practice recognizing all these patterns by playing this quiz below. How many correct answers can you score at the first try?
Candlestick pattern quiz
Do candlestick patterns actually work?
This is where people highly debate the effectiveness of using candlestick as an analysis tool. Academic studies disagree on this, so candlestick patterns are best used as a context tool, not as a forecast. Three well-known tests show why.
Large Taiwanese stocks (Taiwan Top 50 Tracker Fund components), October 2002 to December 2008
Three bullish two-day reversal patterns were profitable
Why Candlestick Analysis May Differ
Market: Different market acts differently, for example: a large and heavily watched U.S. stocks may behave differently from other markets.
Period: A pattern that worked in one decade (or any period) may not work in another.
Pattern definitions: Studies, investors and analysts differ on (for example) how big a body must be, what counts as a trend, whether gaps are required, and so on.
Holding period and exit rule: A two-day hold, a ten-day hold and "hold until the opposite pattern" are different tests and will yield different results.
Costs and statistics: Results that look profitable before trading costs can be negated by those costs.
Remember that patterns are only a way to organize and test theories, on historic price data. They are not a definitive forecast of future behaviors.
Common mistakes when reading candlestick patterns
Acting before the candle closes: an unfinished candle can change shape at the last moment.
Ignoring the prior trend: two same shapes will means different things after a decline and after an advance. Without a trend as an anchor, there is no "pattern".
Reading patterns inside a tight sideways range: in this case, shapes are mostly just noise.
Confusing lookalikes: a hammer and a hanging man, for example, have the same shape. Check the trend first.
Trusting automatic screener labels without looking at the chart: a screener applies fixed numeric rules and knows nothing about trend, level or volume. Always analyze by yourself.
Assuming one timeframe is proven best: choose a timeframe that fits how long you plan to hold.
Trading often on single signals: this multiplies your costs, so be wary.
Using candlesticks as a longer-term investor
If you are investing for the long run, you may (surprisingly) still get useful informations from candlestick charts. Investors can use weekly and monthly charts, which smooth out day-to-day noise, and get the bigger picture of how a stock has behaved in long term.
You can try finding where price has repeatedly paused or turned in the past, and how it reacted after big news gaps such as earnings releases. This helps you judge the asset's behavior and volatility.
Take note that candlesticks say nothing about the fundamentals of the business. It does not show earnings, debt, competitive position, valuation, and so on. There is no replacement for fundamental analysis as the groundwork in investing.
Candlestick patterns FAQ
How many candlestick patterns are there?
There is no single official count, but Bulkowski's Encyclopedia of Candlestick Charts tests 103 patterns, and StockCharts puts the total at a little over 100.
Which candlestick pattern is the most reliable?
No pattern is definitively best or most reliable. It depends on the trend, volume and confirmation behind it.
Which timeframe is best for reading candlestick patterns?
You need to match it to how long you plan to hold. Use intraday charts for short trades, daily for swing trades, weekly and monthly for investors.
Do candlestick patterns work the same way on stocks and 24-hour markets?
Not really. Stocks have a defined open-close and overnight gaps, so gap-based patterns apply more literally.
What is the difference between a candlestick pattern and a chart pattern?
A candlestick pattern is a shape made by one to five candles. A chart pattern, such as a head and shoulders, triangle or double top, is a larger structure formed by many candles over weeks or months.
Can beginners rely on candlestick patterns alone?
No. Beginners will be better off doing research on the company search, and later use patterns to ask further questions, such as: what is the trend, where is the level, did volume agree, where is the idea wrong, et cetera.
Gotrade is the trading name of Gotrade Securities Inc., which is registered with and supervised by the Labuan Financial Services Authority (LFSA). This content is for educational purposes only and does not constitute financial advice. Always do your own research (DYOR) before investing.
Sindhu Partomo is a copywriter and content writer with 8+ years of experience in agencies, B2B, and SaaS. He has been writing about business and finance since 2023, and holds a bachelor degree from University of Indonesia.
Hendrie Saputra holds a Master of Business Administration (MBA) with a concentration in Business Risk & Finance, along with professional experience in finance, marketing, and project management. He is experienced in analyzing market data and developing research-driven business strategies.