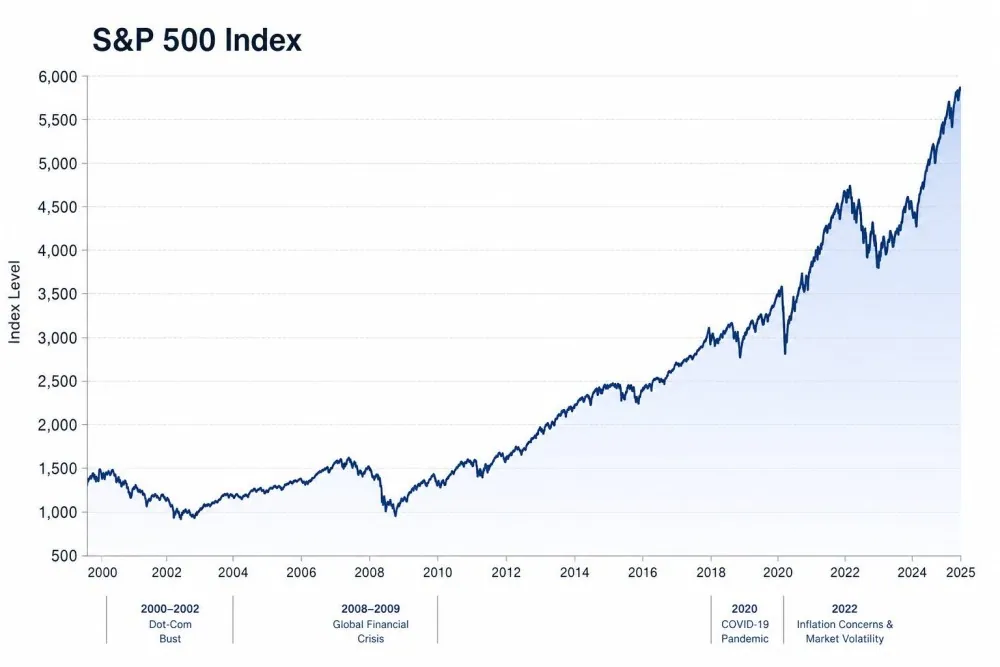
The S&P 500 is an index of 500 large US companies (503 stocks), chosen by a committee at S&P Dow Jones Indices and weighted by float-adjusted market cap, the value of the shares available to the public. It took its 500-stock form in March 1957.
Weight follows size, so the biggest companies move the index most: a stock weighted 8% that rises 5% lifts the S&P 500 by about 0.4%. In a 29 Oct 2026 snapshot of the SPDR S&P 500 ETF, the top 10 held near 38-39% of the total.
The index itself cannot be bought. Exposure comes through ETFs and index funds that track it, which differ in fees, tracking and US dividend withholding tax for non-US investors (often 30% for US-domiciled ETFs, generally 15% for Ireland-domiciled UCITS ETFs).
The S&P 500 is an index of about 500 large US companies, weighted by the market value of their freely tradable shares. The index is used as an indicator of the US stock market performance.
What Is S&P 500?
The S&P 500 (Standard & Poor's 500) is an index consisting of 500 large US companies. The index was founded in 1957. It is maintained by the S&P Dow Jones Indices, a global producer of stock market indices founded in 1882. The composition of the index is determined by a committee, and weighted by float-adjusted market value, which is the value of each company's shares that are available to the public.
The original (and main) purpose of an index like S&P 500 is to act as an indicator, on the current situation of the US stock market. However, various brokers offer exchange-traded funds (ETFs) which track the index.
Difference with S&P 100, S&P 1500, and S&P Global 100
As the name suggests, while the S&P 500 tracks 500 US companies, the S&P 100 and S&P 1500 track 100 and 1500 US companies, respectively.
There is also the S&P Global 100, which tracks 100 large multinational companies from around the world.
A short history of S&P 500
Before the index (1800s-1920s)
Since investors had no way to see how the US market was doing, Charles Dow created the Dow Jones Industrial Average in 1896. It was tracking a handful of companies, but it was seen as useful.
Standard Statistics began publishing a stock index in 1923, covering about 233 companies. In 1926, the company made a narrower 90-stock version and updated daily. These were the ancestors of the S&P 500.
The merger (1941)
Standard Statistics merged with Poor’s Publishing. Poor's was publishing financial information about railroads and other businesses. This then became Standard & Poor’s, or “S&P".
The 500-stock index is born (1957)
In March 1957, Standard & Poor’s expanded its index to 500 companies and began calculating it more often using early computers. Bigger companies also weigh more in the index.
Growing into the benchmark (1960s-1990s)
Professional investors started using the S&P 500 as a benchmark. Many people found that it's difficult to consistently outperform this index every year.
Index funds arrive (1976)
John Bogle (Vanguard) launched the first index fund for ordinary people to buy. This fund copied the S&P 500, and changed the way people invest.
Current era (2000s-today)
The index survived several big crashes: the dot-com bust (2000-2002), the 2008 financial crisis, and the COVID crash in 2020. Today, it is dominated by large technology companies.
How it changes
A committee at S&P Dow Jones Indices decides which companies belong. You can access the document containing the full method, but here are the main points:
1. Eligibility
must be a US company listed on a major US exchange.
market cap must be above a minimum (USD 22.7 billion as of mid-2026, adjusted from time to time).
at least 10% of it shares must be publicly tradable (“float”), and traded by enough people, often enough ("liquid").
must be profitable, proven by positive earnings in the latest quarter and over the last four quarters combined.
generally, it takes about a year of trading history.
2. Selection The index committee then chooses from the eligible companies. Note that being eligible doesn’t guarantee a spot.
3. How the index is calculated
the weighting for each company is done by adjusted market cap (share price x unit of shares publicly traded).
the index level is the total of those values divided by a divisor.
the divisor is adjusted when companies are added or removed.
4. Updates
Share counts and weights are recalculated every quarter, in March, June, September and December.
Mergers, spin-offs and other corporate events are handled as they happen.
Companies are removed when they are acquired or no longer meet the rules, at the committee’s discretion.
How to read the S&P 500 number on your screen
Here is an example of an S&P 500 position, and how to read it. This example uses fictional, not real numbers.
How to read the S&P 500 on your screen
In general, you will have an easier time reading the S&P 500 chart when looking at the percentages of changes, and over a longer period of time. Remember that the actual data on S&P 500 shows history, which has happened. The chart is not a prediction.
Historical performance
Decade
Avg. yearly total return (with dividends)
Beats US inflation?
Major events
1930s
~0%
Yes
The Great Depression
1940s
~9%
Yes
World War II and the postwar recovery
1950s
~19%
Yes
Postwar boom
1960s
~8%
Yes
-
1970s
~6%
No
High inflation, oil shocks
1980s
~17.5%
Yes
Falling inflation and a big bull market, the 1987 crash
1990s
~18%
Yes
Tech and internet boom
2000s
~-1%
No
Dot-com bust and the 2008 financial crisis
2010s
~13.5%
Yes
The rise of big tech
2020s (to date)
~15%
Yes
COVID crash and rebound, the 2022 inflation, AI boom
Why a few companies move the whole index
Since the index is weight-adjusted, each company counts in proportion to its size, so the biggest ones will have more influence.
For example, a stock with an 8% weight that rises 5% ,will lift the index by about 0.4% (8% × 5%), roughly 24 points if the index is at 6,000. Meanwhile a stock with a 0.1% weight that rises 5% lifts it by only about 0.005%, about 0.3 points.
Who are the heaviest weights now?
This is hard to answer, since exact weights move daily with prices. In a snapshot of the SPDR S&P 500 ETF, (29 Oct 2026, closely mirroring the index), Nvidia was about 8.1%, Apple about 7.5% and Microsoft about 5.6%, with the top 10 near 38-39% of the total. Other names in the top 10 include Amazon, Alphabet, Broadcom, Meta, Tesla and Berkshire Hathaway.
Market-cap weighting vs price weighting vs equal weight
This is a short comparison of weighting methods, and why those methods are used, for which effects.
A $500 stock counts 10 times a $50 stock, whatever the company’s size
Stock splits matters
Equal weight
None
500 stocks at 0.2% each
Small and mid-size members matter much more
S&P 500 vs Dow, Nasdaq-100 and US total market
Besides S&P 500, you might have heard about other popular indexes. They each portray different things about the United States market. Here is some of them:
Index
Number of Companies
Weighting
Content
S&P 500
~500
Float-adjusted market cap
Large U.S. companies, ~80% of U.S. market’s value
Dow Jones Industrial Average
30
Share price
Blue chip stocks
Nasdaq-100
100
Market cap (modified)
The largest non-financial Nasdaq-listed companies, tech-heavy
Total market (e.g., CRSP US Total Market)
~3,500+
Market cap
Nearly whole U.S. market
Note: the Nasdaq-100 has also adjusted its rules to add very large new companies sooner, which is one way it now differs from the S&P 500.
What the S&P 500 is used for
A benchmark: fund managers and retirement plans compare themselves to it.
Index funds and ETFs: about $13 trillion in index funds, ETFs and other passive portfolios tracks it, and about $20 trillion in total is indexed or benchmarked to it (S&P Dow Jones Indices, end of 2024).
Derivatives: futures and options on the index are used to hedge or speculate.
A health gauge: news reports and economists use it as a quick read on investor confidence and the economy.
What the S&P 500 number cannot tell
It’s usually price-only. The quoted level does not count dividends, so you may want to check on that.
It’s not adjusted for inflation.
Because a few giants dominate, the index can rise while most of its stocks lag, and vice versa.
It covers large U.S. companies only.
The level itself means little, and you need to look at the history to compare.
How investors outside the US get S&P 500 exposure
Since investors can’t buy “the index” directly, they can purchase shares from funds that mirror the index. These funds are slightly different with each other in both tracking, and fees.
Index funds and ETFs that track the S&P 500
A retail investor can access ETFs, which are traded on an exchange like a stock.
In some countries, there is also Index mutual funds or unit trusts. These are bought from the fund company at a once-a-day price.
Note: some non-US brokers, especially in Europe and the UK, restrict retail access to US-listed ETFs.
What to compare before choosing a tracking fund?
Fees, which is the annual expense ratio.
How close the fund’s actual return is, after all the costs.
The taxation.
Accumulating vs. distributing: accumulating funds reinvest dividends inside the fund. Distributing funds pay them out. How each is taxed depends on your country.
The currency cost, if you are going to use something other than USD.
Liquidity: bigger funds usually have tighter trading spreads.
Small amounts and fractional shares
Many ETFs cost one share’s price per unit, which can be a big chunk of a small budget. This is why many brokers now offer fractional shares or monthly savings plans, so you can invest a set amount, such as €50. Availability differs by broker and by fund, and sometimes only covers certain funds.
Mutual funds and unit trusts often have minimums, but some allow small regular contributions. Fixed commissions can eat a large share of a small purchase, so please check the fees per trade.
Dividends and US withholding tax
The US government withholds tax on dividends paid to non-US investors, and the rate depends on how you hold the stocks.
Holding method
Typical US withholding on dividends
US-domiciled ETF
Often 30%, which may be reduced under tax treaties.
Ireland-domiciled UCITS ETF
Generally 15%.
Luxembourg-domiciled UCITS ETF
Typically the default 30%.
Other points:
US-situs assets held by non-residents can face US estate tax of up to 40% above a $60,000 exemption, while Irish and Luxembourg UCITS ETF shares are generally treated as non-US-situs assets with no such exposure. Whether this applies to you depends on any estate-tax treaty between the US and your country. termstaxesforexpats
Neither type of fund generally subjects non-US investors to US capital gains tax. ssga
Withholding is separate from tax your own country charges on dividends and gains, and some countries give credit for US tax paid.
The best choice varies a lot by country and treaty, and US citizens or residents abroad face different rules, so confirm with a local tax professional.
FAQ
What is the S&P 500, in simple terms? It’s a scorecard for the large U.S. stock market, built from about 500 big companies.
How many companies are in the S&P 500, and why are there more than 500 stocks? There are 500 companies but 503 stocks, because Alphabet, Fox Corporation and News Corp each have two share classes in the index.
Can you buy the S&P 500 directly, or only through a fund? Only through a fund. The index is a list and a formula, not something you can buy.
How is the S&P 500 calculated and weighted? Each company’s weight is its float-adjusted market cap (share price × shares available to the public) divided by the total for all members.
What do ^GSPC, SPX, .INX and .SPX mean, and is the S&P 500 the same as SPY? ^GSPC, $SPX, SPX, .SPX and .INX are all quote symbols for the same index. Different data providers use different ones.
Which companies have the biggest weight right now, and how much do they move it? In a recent snapshot of the SPY fund, Nvidia was about 8.1%, Apple about 7.5% and Microsoft about 5.6%.
Who decides which companies are added or removed? A committee at S&P Dow Jones Indices.
Does the S&P 500 pay dividends? The index itself pays nothing, but its member companies do. Their combined yield is about 1.05% (late Oct 2026), the lowest on record and well below the long-run median of about 4.2% since 1871.
What has the S&P 500 returned historically, and how bad have its worst falls been? Including dividends, the average was roughly 10% a year from 1957 to 2025. The worst calendar years were 2008 (about -37%) and, for the predecessor index, 1931 (about -43%).'
How can someone outside the US get exposure to the S&P 500, and what costs and taxes apply? Through an ETF or index fund, either US-listed or listed locally.
Gotrade is the trading name of Gotrade Securities Inc., which is registered with and supervised by the Labuan Financial Services Authority (LFSA). This content is for educational purposes only and does not constitute financial advice. Always do your own research (DYOR) before investing.
Sindhu Partomo is a copywriter and content writer with 8+ years of experience in agencies, B2B, and SaaS. He has been writing about business and finance since 2023, and holds a bachelor degree from University of Indonesia.
Hendrie Saputra holds a Master of Business Administration (MBA) with a concentration in Business Risk & Finance, along with professional experience in finance, marketing, and project management. He is experienced in analyzing market data and developing research-driven business strategies.