The index scores market sentiment from 0, extreme fear, to 100, extreme greed.
CNN builds it from seven market indicators, each given equal weight.
Readings under 25 are extreme fear, and above 75 is extreme greed.
It describes today's mood and predicts nothing about what comes next.
Check the seven components, not just the headline number.
The Fear and Greed Index is a market sentiment gauge published by CNN Business. It scores investor mood from 0, extreme fear, to 100, extreme greed. The score is an equal-weighted average of seven market indicators.
What a reading like that means for your decisions is where most explanations stop short. This guide covers how the index is built, how to read it, how it differs from crypto versions, and where it fails.
What Is the Fear and Greed Index?
The Fear and Greed Index is a single score that summarises how fearful or greedy US stock market investors appear to be. It runs from 0 to 100. CNN launched the index in 2012 and still maintains it. It combines seven indicators of market behaviour, each given equal weight. Every component updates as new data arrives.
The idea behind it is simple. Excessive fear can push prices below what the underlying businesses are worth. Excessive greed can push them above. The index does not use opinion polls. Every input comes from market data such as prices, options activity, volatility and bond yields.
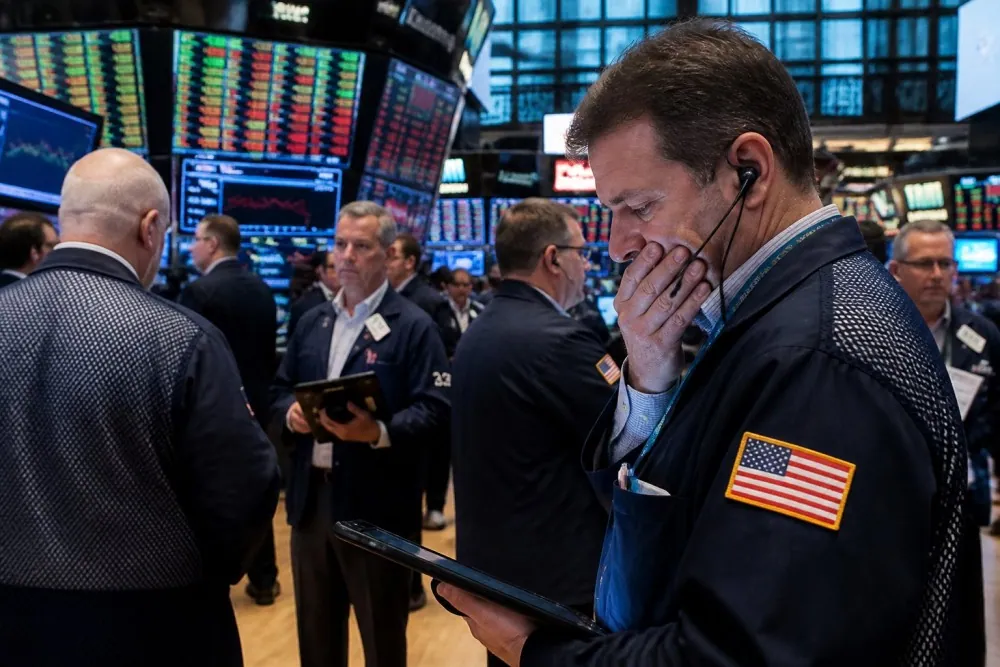
If you came for today's number, CNN publishes the live reading on its Fear and Greed Index page. This guide explains what sits behind that number. The index is easy to read in extreme moments. On Friday, 4 April 2025, during a global selloff after new US tariffs, CNN reported the index at 4. That is about as close to zero as it gets.
What Is Market Sentiment?
Market sentiment is the overall attitude of investors toward the market at a given moment. It describes mood rather than value.
Fundamentals answer what a company is worth. Sentiment answers how investors feel about owning it right now. The two can point in opposite directions for months. Sentiment matters because buyers and sellers set prices, not a formula. When enough people want to reduce risk at once, prices fall regardless of earnings reports.
Sentiment gauges try to put that mood into numbers. Some are surveys that ask investors what they think. Others infer mood from what investors actually do with their money. The Fear and Greed Index belongs to the second group.
How Is the Fear and Greed Index Calculated?
CNN builds the index from seven components. Each is scored on the same 0 to 100 scale, then averaged with equal weight.
Component
What CNN measures
Market momentum
The S&P 500 compared with its 125-day moving average
Stock price strength
Net new 52-week highs versus 52-week lows on the NYSE
Stock price breadth
The McClellan Volume Summation Index, which tracks volume in rising versus falling stocks
Put and call options
The 5-day average put/call ratio
Market volatility
The VIX compared with its 50-day moving average
Safe haven demand
The difference between 20-day stock returns and 20-day Treasury bond returns
Junk bond demand
The yield spread between junk bonds and investment grade bonds
Source: CNN Business, methodology as read on 24 September 2026. CNN notes that stock price breadth had a minor calculation change recently.
Each indicator is judged against its own history. In CNN's words, the index tracks how much each indicator deviates from its average, compared with how much it normally diverges. Equal weighting is the design choice worth knowing. It stops one noisy input from dominating the score. It also means a severe move in one component counts for only one seventh.
That is why the component scores are worth opening. CNN publishes all seven alongside the headline number. Here is a simulation for you to try.
Fear and Greed Index builder
How Do You Read the Index?
The score is usually grouped into five bands. The labels are what most headlines quote.
Score
Label
What it suggests
0 to 24
Extreme fear
Investors are selling risk assets and crowding into safety
25 to 44
Fear
Caution is dominant, but not panic
45 to 55
Neutral
No strong emotional tilt either way
56 to 75
Greed
Risk appetite is above normal
76 to 100
Extreme greed
Buying is aggressive and volatility is unusually low
Commonly used bands. Check CNN's live dial for the current labels.
The reading changes continuously during market hours, so any figure quoted in an article is a snapshot. CNN's page shows the live score plus the previous close and readings from a week, a month and a year ago.
Those comparisons are usually more useful than the single number. A move from 20 to 40 over a month tells a different story from a steady 40. Direction of travel says more than level.
What Does an Extreme Reading Actually Mean?
Extreme readings are often read as contrarian signals. The logic is that when nearly everyone is fearful, much of the selling is done. When nearly everyone is greedy, buyers are running out.
The April 2025 selloff shows what an extreme looks like. CNN reported the index at 4 as markets fell after the tariff announcement. By CNN's account, the index had already sat in fear or extreme fear since December 2024.
Three caveats apply to any extreme reading.
No time horizon. The index says the mood is extreme, not when or whether that mood will reverse.
Extremes can persist. Markets can stay in extreme fear for weeks and keep falling. The same is true of greed in a rally.
Sentiment is not valuation. A market can be fearful and still expensive, or greedy and still reasonably priced.
Brown and Cliff (2004) found that sentiment measures have little power to predict near-term stock returns. Their 2005 follow-up linked high sentiment to lower market returns over the following two to three years.
A Real-World Example
Picture an investor who buys $100 of a broad-market index fund every month. In April 2025, the index hit 4 and the fund fell with the market, so the instinct was to pause or sell.
The index described the crowd's mood, but it said nothing about the businesses inside the fund that month. A plan-based investor keeps the $100 contribution unchanged, since the decision was made before the headline arrived.
Used carefully, an extreme reading is a prompt to check your own behaviour, not a trade signal. Ask whether you are about to act because of a plan or because of a headline.
Stock vs Crypto Fear and Greed Indexes
Search for the Fear and Greed Index and you will also find crypto versions. They share a name and a 0 to 100 scale, but they measure a different market with different inputs.
Price volatility, trading volume and market momentum, scored 0 to 100; component weights are not published
Sources: each provider's methodology page, read on 24 September 2026.
The key difference is the inputs. CNN uses only market data from US stocks and bonds. The crypto indexes add social media activity, search trends and crypto-specific measures.
A crypto reading tells you nothing about the stock market, and the reverse is also true. The two can sit in opposite bands on the same day.
What Other Stock Sentiment Indicators Are There?
The Fear and Greed Index is one gauge among several. Reading two or three together gives a fuller picture than any single number.
The AAII Sentiment Survey
The American Association of Individual Investors has run a weekly survey since 1987. It asks members whether stock prices will rise, fall or stay flat over the next six months.
The long-run averages give you a baseline. AAII puts them at 37.5% bullish, 31.5% neutral and 31.0% bearish. Readings far from those averages draw attention, since the survey is mainly used as a contrarian indicator.
Unlike CNN's index, this is a survey of opinions, not a reading of market data.
The VIX
The VIX, published by Cboe, measures the volatility that S&P 500 options prices imply over the next 30 days. It rises when traders pay up for protection.
It is often called the fear gauge. It is also one of the seven inputs to the Fear and Greed Index, measured against its 50-day average.
The Put/Call Ratio
This compares the volume of put options, which profit when prices fall, with call options, which profit when prices rise.
A high ratio suggests defensive positioning. CNN uses its 5-day average as another of the seven inputs.
Should You Invest Based on the Fear and Greed Index?
As a standalone system, no. The index describes current conditions. It does not forecast them, and it carries several limitations.
It covers US large caps. The inputs come from the S&P 500, NYSE listings and US bond markets. It says little about other markets or small companies.
It looks backward. Moving averages, 52-week highs and 20-day returns all describe the recent past.
It moves fast. A reading can swing from fear to greed within weeks. That is far quicker than most people should change a long-term plan.
There is a more useful way to read it. A sentiment extreme is a signal about the crowd's emotional state. That is a reason to slow down rather than speed up.
For long-term investors, that usually means sticking to the plan. Keep regular contributions going during fear, and resist the urge to concentrate during greed.
Owning a broad market ETF or a diversified set of companies reduces how much any single mood swing matters. It also helps to know what you own. Revenue and earnings change far more slowly than sentiment.
Investing Through Fear and Greed
Sentiment swings are easier to sit through when your plan does not depend on timing them. Repeating the same amount on a set schedule matters more than the reading on any given day.
Conclusion
Next time the index hits an extreme, open the seven components before reacting to the headline number. One panicked component and six calm ones is a different market from all seven moving together, and that distinction only shows up if you look past the single score CNN publishes on its dial.
A market can stay fearful for weeks and keep falling, or stay greedy and keep climbing, so the index works best as a prompt to review your behavior rather than a signal to act on directly.
This content is for educational purposes only and is not investment advice or a recommendation to buy or sell any security. Investing carries risk, including the possible loss of principal.
Gotrade is the trading name of Gotrade Securities Inc., which is registered with and supervised by the Labuan Financial Services Authority (LFSA). This content is for educational purposes only and does not constitute financial advice. Always do your own research (DYOR) before investing.
Muhammad Zhafran Tsany is a digital market with over years of experience, covering personal finance content since 2024, including stock market basics and beginner investing strategy for Rankia Indonesia. He holds a Bachelor of Business in Digital Business from Universitas Pendidikan Indonesia.