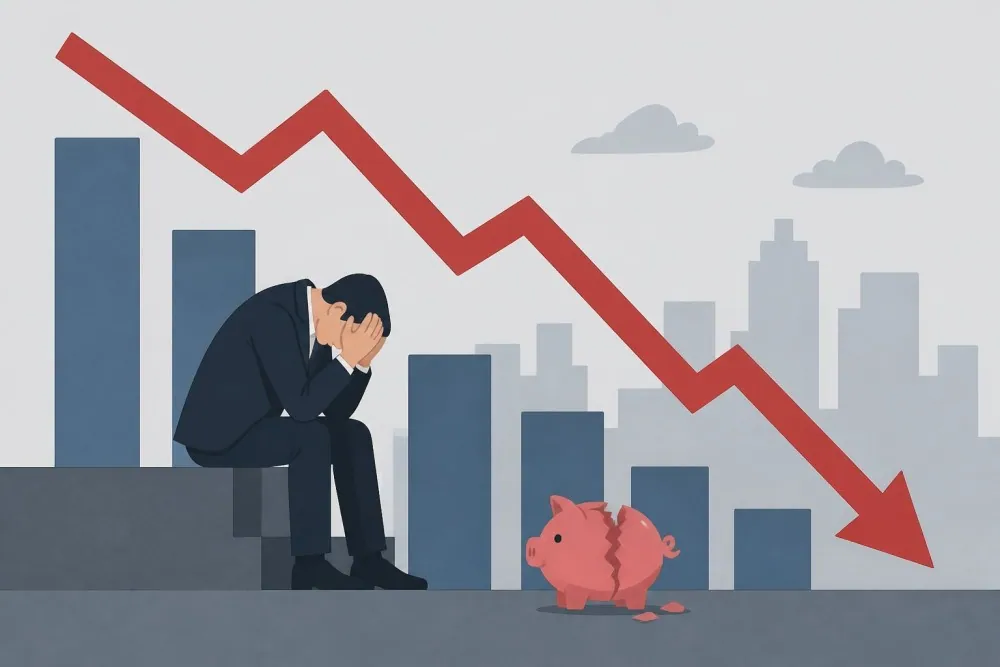
A recession is a significant, widespread, and lasting decline in economic activity. In this article we will discuss what recession is, what the indicators are, and what investors can do to anticipate the best they can. This article is solely for educational purpose, and not a financial advice.
What Is a Recession?
A recession is a significant, and widespread decline in economic activity, usually lasting two consecutive quarters or more. Recession occurs when sales decline, consumption drops, and fewer jobs are available. Other factors that may indicate a recession are declining investments, higher unemployment rate, and a decline in Gross Domestic Product (GDP). Note that those are all general consensus and not a hard definition, as some recessions may not have all those indicators.
Generally, economies move through a repeating business cycle with four phases: an expansion (output, hiring and spending grow), a peak (activity tops out), a contraction (activity falls, which is the recession) and a trough (the low point before recovery begins). Recessions are a normal, recurring part of that cycle, not a sign that the system has broken.
The NBER's official US call: depth, diffusion, duration
When measuring economic downturns, the NBER's Business Cycle Dating Committee treats the three criteria of depth, diffusion and duration as somewhat equal. The committee monitors multiple economy-wide measures, including:
real personal income less transfers
non-farm payroll employment
employment from the household survey
real personal consumption expenditures
real manufacturing and trade sales
industrial production
Note that there is no fixed rule for weighting them. Before announcing a peak, the committee waits until it is confident a recession has occurred. Before announcing a trough, it waits until it is confident an expansion is under way. This is why you may see news regarding recession, many months after the economic starts slowing down.
Turning point | Announced | Months after |
|---|
Peak, December 2007 | December 1, 2008 | 12 |
Trough, June 2009 | September 20, 2010 | 15 |
Peak, February 2020 | June 8, 2020 | 4 |
Trough, April 2020 | July 19, 2021 | 15 |
Trough, March 1991 | December 22, 1992 | 21 |
Global recessions
As you may guess by now, there is no universal definition of a global recession. The IMF researchers define it as "a contraction in world real per capita GDP, accompanied by a broad decline in other global measures such as industrial production, trade and capital flows". The IMF uses a per-capita measure, because population growth differs widely across countries.
On that definition the World Bank identifies four postwar global recessions: 1975, 1982, 1991 and 2009. The 2009 episode, set off by the global financial crisis, was the deepest and most synchronized of the four. A later World Bank analysis of the 2020 pandemic shock counts it as a further global recession (World Bank, June 2020).
What Causes a Recession
Recessions rarely have one cause, but most trace back to one of four types of trigger. The dates below are the NBER's peak and trough months from its chronology.
Cause | Explanation | Example |
|---|
Demand shocks | Households and firms pull back spending or investment | 1990-91 (8 months): the IMF points to Gulf War uncertainty and strains in the US savings and loan industry |
Policy and credit | Central banks raise rates or a financial crisis freezes lending | 1981-82 (16 months): tight monetary policy among other pressures. 2007-09 (18 months): the global financial crisis, per the World Bank |
Supply shocks | Energy, trade or health disruptions | 1973-75: oil prices rose fourfold after the Arab oil embargo (IMF). 2020 (2 months): pandemic closures |
Asset bubbles bursting | Falling asset prices cut wealth | 2001 (8 months): the S&P 500 entered a bear market in March 2000 as the late-1990s technology boom unwound. 2007-09: the housing and credit boom |
Always remember that causes may overlap. The IMF notes that the 1982 global recession combined tight monetary policy (in several developed countries), rapid oil price increases and a Latin American debt crisis. So, what are the general indicators of a recession?
Recession Indicators: How to Read Them
A recession indicator is a data series of economic behaviors. There are certain behaviors which, historically, correlate with the business cycle. There are things that usually happen before, during, and after a recession, so we can use them as warning signs.
Type | Job | Examples | Limit |
|---|
Leading | Moves before turning points | Yield-curve slope, building permits, initial jobless claims, stock prices | Can be false alarms |
Coincident | Moves with the cycle | Payroll employment, personal income less transfers, manufacturing and trade sales, industrial production | Confirms, not warns |
Lagging | Moves after turning points | Unemployment rate, the Conference Board Lagging Economic Index | Too late to warn |
The yield curve
When we talk recessions, we hear a lot about the yield curve. The yield curve is a curve that shows how high the interest rates are, compared to bond length. Generally, the longer you lend the government money through treasury bonds, the higher the interest.
Inversion is when this flips: short-term rates end up higher than long-term ones. When you are getting higher interest in 3-month bond rather than a 10-year one, it signals that investors expect rates to fall later, often because they expect the economy to weaken.
Research from the San Francisco Fed found that every US recession since 1958 to 2018 was preceded by an inversion. The signs started showing anywhere from 6 to 24 months before the downturn. So, what gap should we compare? It is up for debate. The New York Fed uses 10-year minus 3-month spread, while most news headlines use 10-year minus 2-year spread.
The labour market and the Sahm rule
Rising unemployment is an indicator that tends to confirm a recession, but not predict. Economist Claudia Sahm famously built a set of rules, known as Sahm rule, around the speed of that rise. You can try calculating it in four steps:
Take the three-month average of the national unemployment rate for the latest month.
Find the lowest three-month average in the previous 12 months.
Subtract the low from the latest average.
If the gap is 0.50 percentage points or more, the rule signals the start of a recession.
When Sahm proposed it in 2019, the rule was meant to trigger stimulus payment to households early in a downturn. In her own analysis, the rule would have triggered on average within three months of the start of each of the previous six recessions (four months in 2008-09, two months in 2001). (Hamilton Project chapter).
As always, there are exceptions to any rule. When the rule triggered in 2024, Sahm herself wrote that the US was not in a recession, pointing to unusual labour-supply effects such as a surge in immigration and a rise in labour-force participation.
The Conference Board Leading Economic Index
The Leading Economic Index (LEI) combines ten series:
average weekly hours in manufacturing
average weekly initial claims for unemployment insurance
manufacturers' new orders for consumer goods and materials
the ISM index of new orders
new orders for nondefense capital goods excluding aircraft
building permits for new private housing
the S&P 500 index of stock prices
the Leading Credit Index
the interest rate spread (10-year Treasury bonds less the federal funds rate)
average consumer expectations for business conditions
These data series are designed to give warnings, around seven months before a turn in business cycle. lead business-cycle turning points by around seven months. A recession signal fires when the six-month diffusion index is at or below 50, and the six-month annualised growth rate falls below -4.3%. Again, this index acts as a warning and not a verdict.
GDP, GDI and other confirming data
The NBER looks at quarterly real GDP and GDI as the broadest measures, but dates months mainly from monthly data, especially real personal income less transfers and payroll employment, with industrial production and real manufacturing and trade sales given less weight. All of them are useful for confirming a downturn, but too slow for warning.
Why no single indicator is enough
Pay attention how each indicator above has limits, whether false alarms, slow timing or both. The same logic applies to stock market crashes as a recession indicator, as markets often fall before recessions, but they also fall without one.
For example, the S&P 500 lost nearly 34% in the 1987 bear market, and the NBER dated no recession between November 1982 and July 1990. The index also entered a bear market in 2022, without any recession being declared since 2020. We should treat indicators as clues and warnings, but not predictions.
Where the Main Indicators Stand Now
Note: this is not a prediction, nor financial advice. Data is accurate per October 21, 2026.
As of October 21, 2026, none of the main US recession signals below is triggered, and the NBER has dated no recession since the one that ended in April 2020. This information is not a forecast.
Indicator | Latest reading | Trigger level | Status | Primary release |
|---|
Yield curve: 10-year minus 3-month Treasury | +0.88 percentage points (October 19, 2026) | Below 0 (inverted) | Not triggered | FRED T10Y3M |
Sahm rule | 0.00 points (September 2026) | 0.50 points or more | Not triggered | FRED SAHMCURRENT |
Unemployment | 4.2% (September 2026); 4.1% to 4.3% since March | No fixed trigger; feeds the Sahm rule | Context | BLS |
LEI | 99.5 in August 2026, down 0.1% on the month and 0.1% over six months; diffusion 70 | 3Ds rule: diffusion at or below 50 and six-month annualised growth below -4.3% | Not triggered | Conference Board |
Real GDP and GDI | GDP +2.2% annualised in Q2 2026 (Q1: +2.5%); GDI +2.6% | Two consecutive quarterly declines (shorthand only) | Not triggered | BEA |
NBER call | Latest peak February 2020, trough April 2020; no later peak dated | Committee announcement | No new recession dated | NBER |
How Long Recessions Last: The Historical Record
US recessions since 1990 have lasted from 2 to 18 months, and expansions have run far longer. The NBER calls expansion the normal state of the economy and says most recessions are brief.
Recession | NBER peak | NBER trough | Contraction (months) | Preceding expansion (months) |
|---|
2020 | February 2020 | April 2020 | 2 | 128 |
2007-09 | December 2007 | June 2009 | 18 | 73 |
2001 | March 2001 | November 2001 | 8 | 120 |
1990-91 | July 1990 | March 1991 | 8 | 92 |
Average, 1945-2020 | | | 10.3 | 64.2 |
Average, 1854-2020 | | | 17.0 | 41.4 |
Source: NBER business cycle chronology. By NBER convention the first month of a recession is the month after the peak and the last is the trough month. Postwar contractions have averaged less than a sixth as long as postwar expansions.
Recession vs Depression, Slowdown and Bear Market
The four terms measure different things, and only one of them is about stock prices.
Term | What it measures | Typical depth and duration | Who defines it | Historical example |
|---|
Recession | Broad activity across output, jobs, income and sales | Postwar average of 10.3 months (NBER) | The NBER in the US; no global legal definition | 2007-09: December 2007 to June 2009, 18 months |
Depression | An especially severe, prolonged downturn | No formal threshold; the 1929-33 contraction ran 43 months | Informal usage; the NBER does not identify depressions separately (NBER FAQ) | 1929-33 |
Slowdown | Growth that weakens while activity keeps rising | Milder; no fixed length | No official body | Mid-1960s: an inversion was followed by a slowdown, not a recession |
Bear market | Stock prices: a fall of 20% or more from a peak | S&P 500: about 57% over 17 months in 2007-09; about 34% in five weeks in 2020 | Market convention | 1987 and 2022, neither followed by a dated recession |
A bear market can occur without a recession, so the terms should not be used interchangeably. Figures for the 2007-09 and 2020 market falls are in the next section.
What Recessions Have Meant for Stock Markets
Stock prices look ahead, so they tend to move before the economic data. They often fall ahead of a recession and bottom before its official end, but outcomes have varied widely. Two episodes show the pattern; neither is a forecast.
2007-09. The S&P 500 peaked in October 2007, two months before the NBER's December 2007 peak, and fell about 57% to a trough on March 9, 2009. The NBER dated the economic trough three months later, in June 2009, and did not announce it until September 2010.
2020. The S&P 500 fell 34% from its February 19 peak to a March 23 low, before the NBER's April 2020 trough. It closed at a record high in August 2020 while unemployment was still 10.2%.
In both cases the market bottomed before the economy did, yet the size and speed of the fall and recovery differed sharply. Averages across episodes hide that range, so this guide does not offer one.
How Long-Term Investors Think About Recession Risk
This section is education, not personal advice. It summarises general principles from the SEC's Office of Investor Education and Advocacy, the office behind Investor.gov.
Asset allocation and diversification. The returns of stocks, bonds and cash have historically not moved up and down together, so holding more than one asset category can smooth the ride. Diversifying within each category helps too.
Time horizon. A long-term goal may justify more risk in stocks or bonds, while cash can suit short-term goals. The main risk of cash is that inflation erodes its returns.
Rebalancing. Rebalancing returns a portfolio to its original mix. Some investors do it on a calendar basis, such as every six or twelve months, others when an asset class drifts by a preset percentage. It tends to work best when done infrequently.
Emergency fund. The SEC suggests holding enough savings to cover an emergency such as sudden unemployment, with some investors keeping up to six months of income, and says this matters particularly during a downturn.
Dollar-cost averaging. Investing the same amount on a regular schedule buys more when prices are low and less when they are high, which reduces the risk of putting everything in at the wrong time.
None of this predicts a recession or tells you how to respond to one. A registered investment professional can help apply these principles to your own goals and risk tolerance.
FAQ
What is a recession indicator and what does it mean?
A recession indicator is a data series, whose behavior historically correlate with the business cycle. There are Leading indicators (e.g. yield curve), coincident indicators (e.g. payroll employment), and lagging indicators (e.g. unemployment rate). No indicator can predict or confirm recessions singlehandedly.
Which recession indicators have the best track record?
The inverted yield curve and the Sahm rule have the strongest historical records. Before 2022, an inversion preceded every US recession since 1955 with two false positives (mid-1960 and 2022-24 inversion). The Sahm rule signals early in downturns, but triggered in July 2024 without a recession dated since. Treat every indicator as a warning, and not a verdict.
Are we in a recession right now?
There is no confirmed recession from the NBER, since the last recession ended in April 2020. As of October 2026, the yield curve is not inverted, Sahm indicator reads 0.00 and real GDP grew by 2.2% in the second quarter (US). Remember that the NBER has confirmed the start of recent recessions 4 to 12 months after they began, and their end up to 21 months later.
Who officially declares a recession, and how long after it starts?
In the US, the business cycle dating committee of the National Bureau of Economic Research (NBER), a private nonprofit research organization, sets the recession dates that government, markets and media use.They have announced peaks (the start of a recession) 4 to 12 months after the fact, and troughs (the end of a recession) 8 to 21 months after the fact.
Is two consecutive quarters of negative GDP a recession?
Not by itself. While most NBER-dated recessions include two or more quarters of falling real GDP, it did not happen to the 2001 recession.
Can a stock market crash cause or signal a recession?
A crash can signal trouble because prices look ahead, and a severe one can hurt spending by reducing household wealth, but it is an unreliable indicator. Markets often fall before recessions yet also fall without one: the S&P 500 lost nearly 34% in 1987, and the NBER dated no recession then.
What happens to jobs, interest rates and stock prices during a recession?
Jobs: unemployment usually rises during a recession and often keeps rising after the trough. Interest rates: central banks typically cut rates to lift demand. Stock prices: they tend to fall before the recession and bottom before it ends, with wide variation between episodes.
How do long-term investors approach recession risk?
The SEC's investor education guidance stresses general principles: maintain an emergency fund, spread money across asset categories, match the mix to your time horizon, rebalance occasionally and consider investing a fixed amount regularly. This is education, not personal advice; a registered adviser can tailor a plan to your situation.