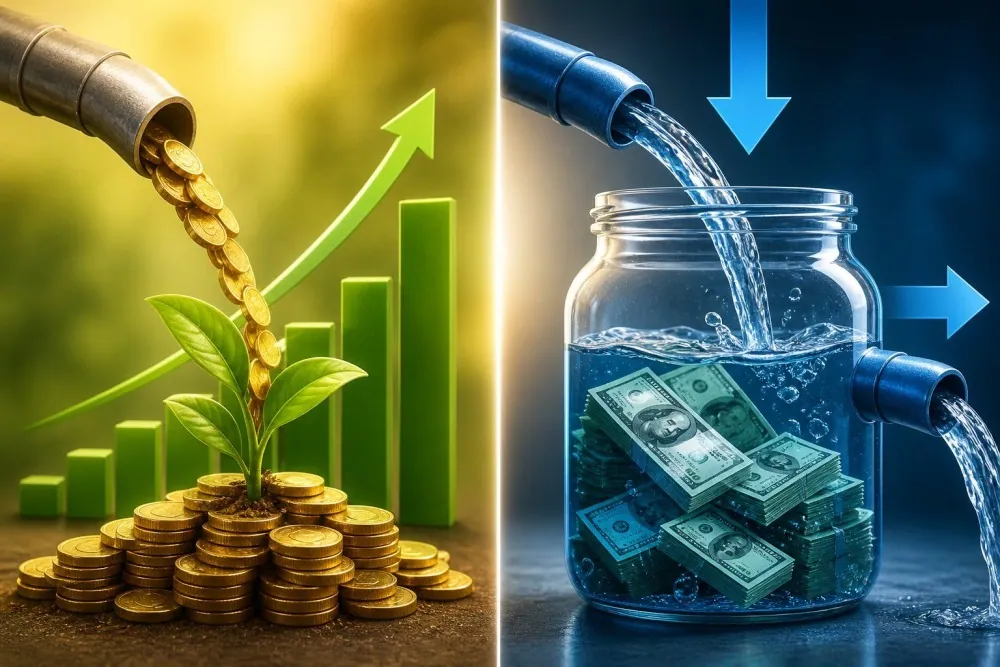
Net cash flow is the change in a company's cash balance over a period.
Free cash flow is operating cash flow minus capital expenditure.
Free cash flow shows whether dividends and buybacks are actually affordable.
Free cash flow has no accounting definition, so providers calculate it differently.
Cash flow helps business owners, CFOs, and CEOs understand how much money comes into a company, how much goes out, and what’s left over. But different cash flow measures tell you different things. Free cash flow shows what’s left after paying for operations and capital spending, while net cash flow shows how much the company’s total cash balance changed over the period.
With those two combined, now it's not only important for the company's members, it is also important and helpful for investors. In this article you will learn their definition, how to calculate them, and how it can be used for retail investors
What Is Net Cash Flow?
Net cash flow is the change in a company’s cash balance over a period, simply money in minus money out across everything the business did. For example, let's say there is a company that starts the year with $30 billion and then the company ends the year with $36 billion on their cash so that company has a net cash flow of $6 billion.
Every cash flow statement builds that number from three sections;
operating covers running the business
investing covers buying and selling long-term assets
financing covers debt, share issuance, buybacks and dividends
The split matters more than the total, because cash that grows through borrowing tells a different story from cash earned through sales, and a falling balance may just mean debt was repaid. That is why analysts treat net cash flow as a starting point, not a conclusion.
Apple's cash balance rose from $29.94 billion to $35.93 billion over the year, which matches that $5.99 billion exactly. Look at what drove it, the business produced $111 billion, and $121 billion went out through financing, mostly buybacks, dividends and debt repayment.
A reader who saw only the $6 billion net figure would badly misjudge how much cash this business actually generates.
What Is Free Cash Flow?
Free cash flow is the cash a company has left from operations after paying for the physical assets it needs to keep running. It is a stricter test than net income, because it tracks actual cash rather than accounting profit. A company can report healthy earnings and still generate little free cash if its spending on equipment and facilities is heavy.
The word “free” means discretionary. This is the money available to pay dividends, buy back shares, repay debt, make acquisitions or simply build up cash. A business with steady free cash flow has choices, while one that burns cash must borrow or issue new shares.
How Do You Calculate Free Cash Flow
Free cash flow = operating cash flow minus capital expenditure
Capital expenditure, or capex, is spending on long-term assets such as factories, equipment and data centres. On the cash flow statement, it appears as payments for property, plant and equipment.
Apple’s figures give a clean calculation.
Input, Apple FY2025
Amount
Cash generated by operating activities
$111.48 billion
Less capital expenditure
-$12.72 billion
Free cash flow
$98.77 billion
Source: Apple Form 10-K, fiscal year ended September 27, 2025.
That $98.77 billion paid for most of the cash Apple returned to shareholders during the year. The company spent $90.7 billion on buybacks and $15.4 billion on dividends, together about $7 billion more than its free cash flow. The gap had to come from elsewhere, such as existing cash, investments or borrowing. Comparing free cash flow with actual pay-outs is a quick test of sustainability. If returns consistently exceed free cash flow, the company is drawing down reserves or adding debt to keep them going.
What Is the Difference Between Free Cash Flow and Net Cash Flow?
Net cash flow measures the cash balance. Free cash flow measures the cash-generating ability of the business.
Feature
Net cash flow
Free cash flow
Question answered
Did the cash balance rise or fall?
How much spare cash did the business produce?
Includes financing
Yes
No
Includes capex
Yes, inside investing
Yes, subtracted directly
Apple FY2025
$5.99 billion
$98.77 billion
Mainly used for
Liquidity and solvency checks
Valuation and dividend sustainability
A company can have negative net cash flow and excellent free cash flow, which is exactly Apple's position in several recent years. The cash left because management chose to return it. The reverse also happens. A struggling company can report positive net cash flow in a year it raised debt or sold assets, while its operations consumed cash.
Free cash flow vs net cash flow calculator
Why Do Investors Watch Free Cash Flow More Than Profit?
Profit is an accounting result. Free cash flow is money that actually moved. Apple reported $112.01 billion of net income in fiscal 2025 and $98.77 billion of free cash flow. The gap comes from items that affect profit and cash differently.
Depreciation reduces profit without any cash leaving in that period. Working capital changes move cash without touching profit, and capex consumes cash but enters profit slowly over years.
Three practical uses follow for an investor.
First, it tests whether payouts are affordable. Dividends and buybacks come from cash, so comparing them against free cash flow shows whether they are funded by the business or by borrowing. Our guide todividend yield covers the payout side of that comparison.
Second, it is harder to flatter. Accounting judgement shapes reported earnings, while cash either arrived or it did not.
Third, it underpins valuation. Most formal valuation models discount future free cash flows rather than future earnings.
What Is Free Cash Flow Yield?
Free cash flow yield expresses free cash flow as a percentage of the company's market value. It answers how much cash the business generates for each dollar of its price.
Using Apple's $98.77 billion and an illustrative market capitalisation of $3.7 trillion, the yield is about 2.7%.
It is the cash equivalent of an earnings yield, and it is read the same way. A higher yield means more cash generation per dollar of price, which can signal either good value or a business the market expects to deteriorate.
Free cash flow yield is also a useful sense check against the dividend. A company paying out more than it generates is drawing on cash reserves or debt to do it.
Can Free Cash Flow Be Negative?
Yes, and the reason matters more than the sign.
Negative free cash flow means capital spending exceeded the cash operations produced. For a company building capacity, that can be a deliberate investment in future earnings. For a mature company, the same number is a warning. It suggests the core business no longer covers the cost of keeping itself running.
Two questions separate the cases. Is operating cash flow itself positive, and is the capex building something new rather than replacing what already exists? A company with positive operating cash flow and heavy expansion capex is in one position. A company whose operations consume cash before any investment is in another.
Where Do You Find These Numbers?
Both come from the cash flow statement, one of the three financial statements in every US company's filings. The SEC'sbeginners' guide to financial statements explains how the three relate. Annual figures sit in the Form 10-K and quarterly figures in the Form 10-Q, both free to read on the SEC's EDGAR database. Companies also publish the same statement in their quarterly results release.
Net cash flow is usually the line labelled increase or decrease in cash and cash equivalents and free cash flow is not a line at all, so you calculate it from the operating total and the capex line.
One warning about third-party data is that free cash flow is not defined under accounting standards, so providers calculate it differently, with some subtracting leases, acquisitions or stock compensation. Check the definition before comparing two sources.
What Are the Limitations of These Measures?
Four cautions keep both numbers in proportion.
Capex is lumpy. A company building a factory can report weak free cash flow for two years and strong free cash flow afterwards. The underlying business has not changed.
Negative free cash flow is not automatically bad. Young companies investing heavily often run negative for years, and the question is whether the spending earns a return.
Working capital can flatter a single period. Delaying supplier payments raises operating cash flow temporarily without improving anything.
Stock-based compensation is a real cost that does not reduce operating cash flow. For companies paying heavily in shares, free cash flow therefore looks better than the economics.
The fix for all four is the same: read several years together rather than one. Trends in cash generation are far more informative than a single annual figure.
They belong in the same review as everything else in yourinvestment portfolio. Gotrade gives access to US-listed stocks with fractional shares from $1. Every company's cash flow statement is free to read on SEC EDGAR alongside it.
Conclusion
Open the cash flow statement of a company you follow and write down three numbers: operating cash flow, capital expenditure, and the change in cash. Then calculate free cash flow yourself. Doing it once makes the difference between the two measures permanent.
This content is for educational purposes only and is not investment advice or a recommendation to buy or sell any security. Investing carries risk, including the possible loss of principal. Company figures are taken from filings on the dates stated, and the market capitalisation used in the yield example is illustrative.
Gotrade is the trading name of Gotrade Securities Inc., which is registered with and supervised by the Labuan Financial Services Authority (LFSA). This content is for educational purposes only and does not constitute financial advice. Always do your own research (DYOR) before investing.
Muhammad Zhafran Tsany is a digital market with over years of experience, covering personal finance content since 2024, including stock market basics and beginner investing strategy for Rankia Indonesia. He holds a Bachelor of Business in Digital Business from Universitas Pendidikan Indonesia.