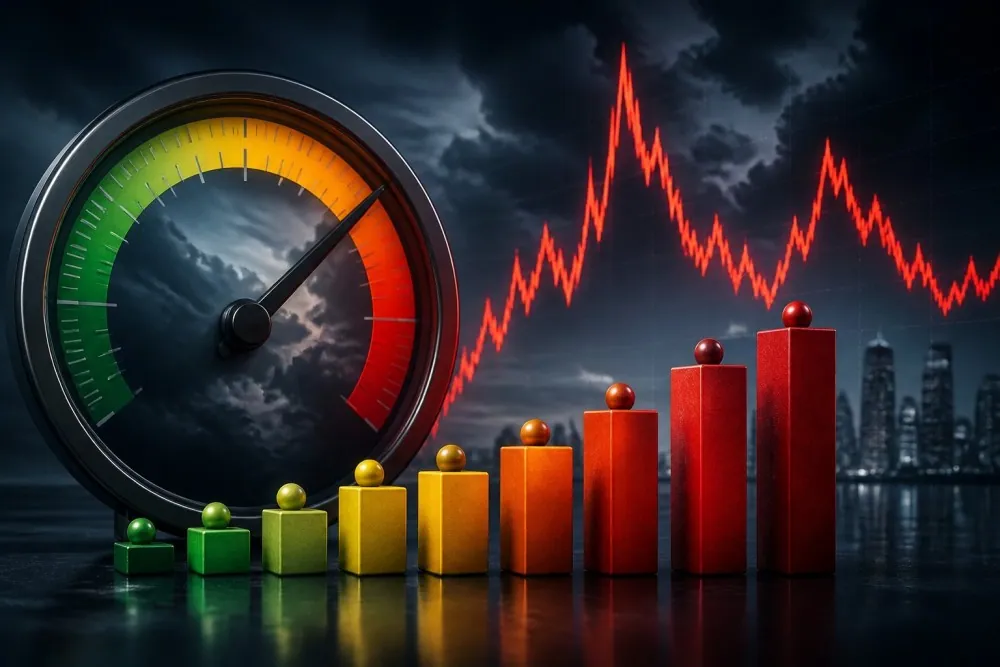
The VIX measures the volatility the market expects in the S&P 500 over the next 30 days, calculated from S&P 500 option prices.
S&P Dow Jones Indices treats 0 to 15 as low, 15 to 20 as normal and above 30 as extremely high turbulence.
There is no VIX stock. The index cannot be bought directly
The VIX shows how big a move is expected, never which direction
If you are new to stock trading or investing, reading charts and numbers often feel dry and overwhelming? but there is one metric that act as an unfiltered lie-detector for market mood, it is the VIX, or Volatility Index, often nicknamed Wall Street’s "fear gauge," it gives everyday traders a front-row seat to the emotional climate of the stock market.
Usually standard stock indexes tell you where prices have already gone and you must analyze them yourself, but the VIX looks forward, using market data to estimate how wild or smooth the ride will be over the next 30 days, think of it as a financial storm warning system
In this article you will learn what the VIX number measures, how to turn a reading into an expected range, and why no VIX stock exists.
The CBOE Volatility Index or The VIX first launched by CBOE Global Markets in 1993 using S&P 100 options, the methodology was updated in 2003 to measure the implied volatility of the broader S&P 500 index over a 30-day forward horizon.
Because the ticker looks like a standard stock symbol, many investors mistake it for an equity; however, the VIX is purely a calculated index derived from option prices rather than underlying share prices, a distinction that carries significant practical consequences for anyone looking to track or trade it.
Cboe’s official methodology document highlights that the index is explicitly designed to measure the market's expectation of 30-day forward volatility as reflected in S&P 500 index options and it operates like a financial storm warning system: high spikes reflect widespread panic and heavy demand for downside protection, whereas lower readings indicate market calm, stability, and investor confidence.
Expected volatility measures the market's anticipation of price swings, whereas realized volatility measures how much stock prices actually moved after the fact. For financial professionals, analyzing and trading the spread between implied expectation and realized outcome forms the basis for sophisticated risk-management strategies.
How Is the VIX Calculated?
The calculation runs continuously through the trading day. Four inputs decide the result.
Input
What it does
S&P 500 options
Supplies the prices the whole index is derived from
Expiry window
Contracts with more than 23 and fewer than 37 days to expiry are eligible
Strike weighting
Each option is weighted in inverse proportion to the square of its strike price
Interpolation
Near-term and next-term expiries are blended to a constant 30-day term
Source: S&P Dow Jones Indices and the Cboe VIX methodology.
Two details in that table explain most of the index's behaviour. The expiry window means the VIX always looks 30 days ahead.
Cboe interpolates between two expiries to hold that term constant as contracts age and the strike weighting means low-strike options count for more. Deep out-of-the-money puts, the contracts people buy as crash insurance, carry outsized influence on the reading.
The final step is simple. The calculated volatility is multiplied by 100, so a result of 0.1393 is published as a VIX of 13.93.
What Does a VIX Level Actually Mean?
There is no official threshold for high or low. S&P Dow Jones Indices publishes interpretation bands that most market commentary follows.
VIX level
Described as
Typical reading of conditions
0 to 15
Low
Optimism
Above 15 to 20
Moderate
A normal market environment
Above 20 to 25
Medium
Growing concern
Above 25 to 30
High
Turbulence
Above 30
Extremely high
Extreme turbulence
Source: S&P Dow Jones Indices VIX introduction.
Treat the bands as a vocabulary rather than a signal. They describe how a reading is usually characterised, not what will happen next. Context matters more than the band. A VIX of 22 after months in the mid teens says something different from a VIX of 22 falling back from 40.
How Do You Turn a VIX Reading Into an Expected Range?
This is the part most explanations skip, and it is what makes the number usable. The VIX is quoted as an annualised figure. To get the expected move over the next 30 days, divide it by the square root of 12. A month is roughly a twelfth of a year.
VIX reading
Implied 30-day range
10
About 2.9% either way
15
About 4.3% either way
20
About 5.8% either way
30
About 8.7% either way
80
About 23.1% either way
VIX expected range calculator
S&P Dow Jones Indices gives the same arithmetic in its own examples. A VIX of 10 implies the S&P 500 is expected to trade between 2.9% lower and 2.9% higher over the period.
One caution belongs with that table. The figure is a one standard deviation range. By convention that covers roughly two outcomes in three, so a larger move is normal rather than surprising.
Run the conversion once and the headlines read differently. A VIX of 30 is not a forecast of disaster, it is the market pricing a plausible monthly swing of under 9%.
Why Is the VIX Called the Fear Index?
Because it usually rises when the S&P 500 falls, and it rises fastest when the fall is sudden.
Demand for protection explains it. When prices drop, more investors bid for put options, those higher option prices feed into the calculation, and the index climbs. Cboe examined the link directly. Its analysis ofthe VIX and its correlation to the S&P 500 concluded that the comparison is close, at about an 80% correlation.
The remaining fifth is the part worth remembering. Roughly 20% of the time the two index move in the same direction, so the relationship is reliable rather than mechanical. The nickname also oversells the index. A high VIX reflects the price of protection, which rises with uncertainty in either direction, not with pessimism alone.
What Have the VIX's Extremes Been?
The index has a 36-year daily history, and its peaks line up with the events you would expect. Daily closing values published by the Federal Reserve Bank of St. Louis from Cboe data put therecord close at 82.69 on March 16, 2020, during the first weeks of the pandemic selloff.
The 2008 financial crisis produced the previous record, a close of 80.86 on November 20, 2008. The highest intraday print came earlier that autumn, at 89.53 on October 24, 2008. Spikes also happen without a crisis. On August 5, 2024 the VIX closed at 38.57 after opening far higher, then fell back within weeks.
Mean reversion is the pattern across all of them. High readings have historically subsided, though nothing in the index guarantees how long that takes. The same episodes show up as volume and price gaps on a chart, which our guide toreading a stock chart covers.
Is There a VIX Stock You Can Buy?
No. The phrase VIX stock is one of the most common misunderstandings in this topic, and it costs people money. S&P Dow Jones Indices states the position plainly. It is not possible to invest in the VIX directly or to replicate its performance.
What is actually for sale
Three kinds of instrument reference the VIX. Cboe lists VIX futures and VIX options, and various issuers offer exchange-traded products built on VIX futures indices. The distinction is not academic. FINRA notes that volatility-linked exchange-traded products aredesigned to track VIX futures, rather than the VIX itself.
Why the gap matters over time
Futures further out usually cost more than futures expiring soon. A product that keeps rolling into the next contract therefore keeps selling cheap and buying expensive.
FINRA's conclusion in the same notice is blunt. It states that many volatility-linked ETPs are highly likely to lose value over time. Such products, it adds, will likely continue to lose value over longer periods.
Regulators have acted on it. InNovember 2020 the SEC charged five firms over sales of a volatility-linked ETP. Representatives had recommended holding it for months or years, the agency said, despite warnings in the offering documents.
None of that makes these products fraudulent. It makes them short-horizon trading tools that behave badly in a buy-and-holdinvestment portfolio.
How Do Investors Actually Use the VIX?
Most long-term investors use it as a thermometer rather than an instruction, the common uses are straightforward by reading the VIX, it gives context for a headline, sets expectations for how wide the next month's swings might be, and flags when option premiums are expensive.
Short-term traders watch it far more closely, because rising volatility widens spreads and changes position sizing, as our guide today trading explains.
What the VIX does not provide is a buy signal. Low readings have persisted for years, and high readings have gone higher before reverting.
It also sits alongside other forward-looking market measures rather than replacing them. Theyield curve prices expectations in bonds much as the VIX prices them in options.
What Are the VIX's Limitations?
The VIX is useful, but a few limitations keep the index in proportion. It is not directional, so it tells you how big a move is expected but never which way, and that is the single most common misreading. It also covers one horizon and one market. The reading describes the next 30 days in the S&P 500, so it says nothing directly about small caps, individual shares or the year ahead.
The index reflects demand as well as expectation. Heavy buying of protection lifts option prices, which lifts the VIX, even when the underlying outlook has not changed much.
Cboe also cautions in its own methodology that the index may not reflect the expected volatility of the S&P 500 under certain market conditions. The published number is an output of available option quotes, not a measurement of reality.
Gotrade gives access to US-listed stocks and ETFs with fractional shares from $1. Position sizes can stay small while you learn how your own holdings behave through volatile stretches.
Conclusion
The VIX is a forward-looking estimate of how much the S&P 500 could move over the next 30 days, not a stock you can buy and not a signal about direction. Before reading anything into a headline, divide the level by 3.46 to see the monthly move the market is actually pricing.
Remember too that volatility-linked products track VIX futures, not the index itself, and that makes them poor fits for a buy-and-hold portfolio as volatile stretches are easier to handle when your positions are sized for them.
This content is for educational purposes only and is not investment advice or a recommendation to buy or sell any security. Investing carries risk, including the possible loss of principal. Index levels cited are as published on the dates stated and change continuously.
Gotrade is the trading name of Gotrade Securities Inc., which is registered with and supervised by the Labuan Financial Services Authority (LFSA). This content is for educational purposes only and does not constitute financial advice. Always do your own research (DYOR) before investing.
Muhammad Zhafran Tsany is a digital market with over years of experience, covering personal finance content since 2024, including stock market basics and beginner investing strategy for Rankia Indonesia. He holds a Bachelor of Business in Digital Business from Universitas Pendidikan Indonesia.