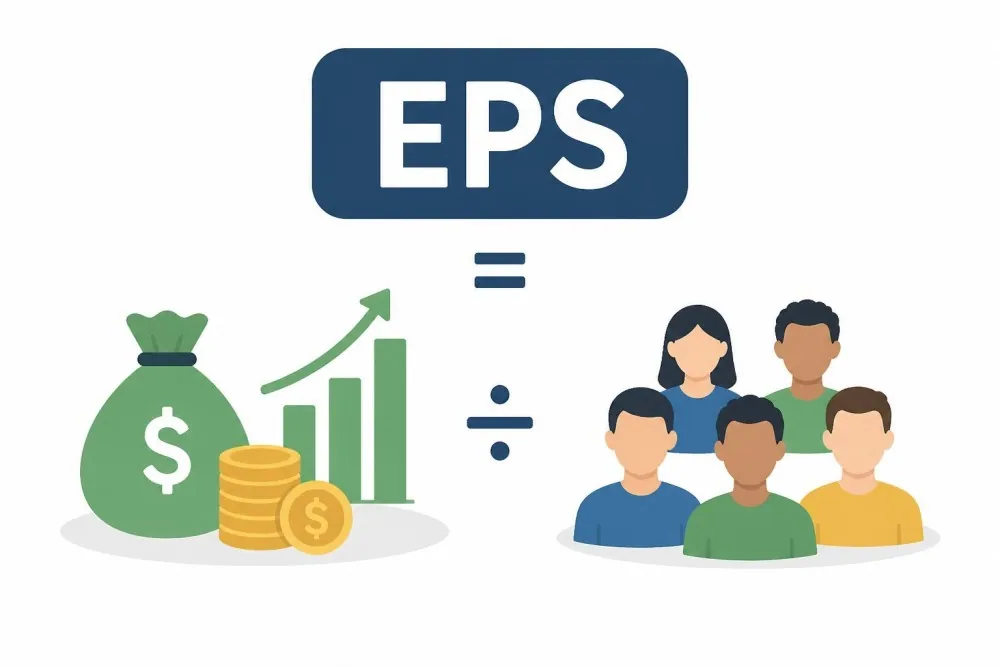
EPS is the profit attributable to each common share. It is not the same as dividends, which are what the company actually pays out.
Basic EPS uses the shares that exist today, while diluted EPS also counts shares that options, convertibles and RSUs could create.
GAAP EPS follows standard accounting rules, while adjusted EPS is the company's own version with certain items removed.
No single number is "good EPS". Check EPS growth, consistency, revenue growth, results against analyst expectations, earnings quality, share buybacks, cash flow, and P/E compared with similar companies.
EPS can rise through cost cuts, buybacks or one-time gains without the business improving. Forward EPS is only a forecast, and a beat doesn't guarantee the stock will rise.
Earnings per share (EPS) tells you how much profit a company earned for each share of its common stock. It’s one of the first numbers investors check when judging how profitable a company is, but it isn’t the same as dividends, which are the cash a company actually pays out.
This guide covers how EPS is calculated, where to find it, and how to read it on a real earnings report.
What is EPS?
Earning Per Share (EPS) is the money you would receive for each share you own, if all profits were distributed. This is an important metric when you do fundamental analysis, since EPS can give you a clue on how profitable a company is.
On the other hand, a company may or may not distribute all profits to its shareholder at certain time periods. When a company pay out cash to shareholders, it is called dividends. Keep in mind that EPS is not necessarily equal to dividends, which is a separate concept.
You can read EPS data from different sources:
The company's investor relations page: This should ideally be your primary source. Look for the latest earnings release or 10-Q/10-K.
Yahoo Finance: Search the ticker, then check the "Statistics" tab for trailing EPS and the "Analysis" tab for estimates and past surprises. The quote page also shows EPS (TTM) in the summary.
Google Finance: Search the ticker and scroll to the financials section for quarterly EPS.
SEC EDGAR (sec.gov): Official filings, where EPS appears on the income statement.
Your brokerage app: Most show EPS on the stock's overview or financials tab.
EPS = (Net income − Preferred dividends) ÷ Weighted-average common shares outstanding
Net income: the company's total profit after all expenses, interest, and taxes. You can find this in the company's income statements.
Preferred dividends: companies may have preferred holders, whose dividends are paid before everybody else. Since EPS is meant to picture the profit per common share, you subtract it. If there is no preferred holders, this value is zero.
Weighted-average common shares outstanding: the average number of common shares that were outstanding during the period, with each share count weighted by how long it was outstanding.
Why use weighted average?
Since we want EPS to represent the average profit along the year, we use weighted average to picture how many shares are around, in average, during the year a company was making profit. if a company issues a big batch of shares on December 30, those shares barely helped earn the year's profit. A weighted average gives them a tiny weight (two days; 2/365) instead of counting them as if they had been there all year.
Basic vs diluted EPS
Companies often have securities that can become common shares later:
Stock options and warrants: these give rights to buy shares at a set price
Convertible bonds or convertible preferred stock: can be swapped for shares
Restricted stock units (RSUs): an employer's promise to grant company shares or cash after an employee meet specific conditions.
When all those become common shares, the same profit will get split across more shares, and the EPS drops. Basic EPS uses only the common shares that actually exist today, while diluted EPS shows what EPS could be if those securities become shares, so investors aren't surprised later.
Diluted EPS Formula
Diluted EPS = (Net income − Preferred dividends + adjustments) ÷ (Weighted-average shares + potential new shares)
Note: "Adjustments" add back costs that would disappear if those securities became shares, for example after-tax interest on convertible bonds.
How to find and read EPS on a real earnings report
NVIDIA, three months ended July 26, 2026 ($M except per share)
Amount
Revenue
96,221
Gross profit
72,142
Operating income
63,734
Other income, net
7,773
Income before income tax
71,507
Income tax expense
11,819
Net income
59,688
Net income per share: Basic
$2.47
Net income per share: Diluted
$2.46
Weighted-average shares, basic
24,190
Weighted-average shares, diluted
24,285
Source: NVIDIA Corporation, condensed consolidated statement of income for the quarter ended July 26, 2026 (Form 10-Q). Share counts in millions.
The statement shows basic EPS of $2.47 and diluted EPS of $2.46. This is on 24,190M basic and 24,285M diluted weighted-average shares.
NVIDIA has no preferred dividends, so the calculation goes: $59,688M ÷ 24,190M = $2.467 for basic, and ÷ 24,285M = $2.458 for diluted. The 95M share gap is the dilution from unvested stock awards and similar instruments.
GAAP vs adjusted (non-GAAP) EPS
GAAP stands for Generally Accepted Accounting Principles, issued by Financial Accounting Standards Board. US public companies must follow this guide when preparing financial statements.
"GAAP EPS" simply means earnings per share calculated under those rules, with nothing added back or removed. "Non-GAAP" or "adjusted" EPS is the company's own variation, where management strips out items it considers unusual or non-cash.
For this quarter, NVIDIA reported GAAP diluted EPS of $2.46 and non-GAAP diluted EPS of $2.22. NVIDIA explains how the number changes:
NVIDIA, three months ended July 26, 2026 ($M except per share)
Amount
GAAP net income
59,688
Gains from equity securities, net (pre-tax, removed)
−7,771
Acquisition-related and other costs (added back)
+222
Other (B) items (added back)
+298
Net pre-tax adjustments
−7,251
Tax effect of adjustments
+1,517
Non-GAAP net income
53,954
Non-GAAP diluted EPS (÷ 24,285M diluted shares)
$2.22
Source: NVIDIA Corporation, reconciliation of GAAP to non-GAAP financial measures for the quarter ended July 26, 2026. Share counts in millions.
Both GAAP and non-GAAP EPS exist for investors to consider. It is a common practice to start reading the GAAP numbers first.
Trailing (TTM) vs forward EPS
Trailing (TTM) EPS is reported EPS history of the last four quarters, summed. NVIDIA's GAAP diluted EPS for the last four quarters:
Q3 FY26 was $1.30 and Q4 FY26 was $1.76.
Q1 FY27 was $2.39 and Q2 FY27 was $2.46 (from the releases above).
Sum: $7.91.
Forward EPS is an analyst consensus estimate for the next fiscal year (or next 12 months). Remember that it's a forecast, not a reported figure. This analysis is usually on a non-GAAP basis.
EPS beat, miss and consensus estimates
Consensus is the average of analyst estimates for the quarter. A beat means reported EPS came in above it, and a miss means below. "Beat by $0.05" simply means actual EPS came +$0.05 above the expected consensus.
Beats are usually measured on the adjusted (non-GAAP) number, because that is what analysts base their forecast on.
What is a good EPS?
There is no single number that defines a "good EPS", so you can use several indicators to help assessing a company. There is no guarantee on any indicator, and every investment carries its own risks.
Revenue growth: Remember, EPS can rise by cutting costs or buying back shares. Check if sales and revenue is growing too.
EPS growth: Is EPS rising year after year?
Consistency: Is the growth steady, or is there any spike and fluke?
Results vs expectations: Compare reported EPS to the analyst consensus. A beat is generally a good sign, even if the stock can still fall.
Quality of the earnings: Look at GAAP EPS, not just the adjusted version, and see what drove the profit.
Share count: When a company buys back shares, EPS rises even if total profit stays the same.
Cash flow: Real profits generally show up as cash. If EPS is high but the company isn't generating cash, it is something to watch closer.
Valuation (P/E): Divide the stock price by EPS, and see what you're paying for each dollar of earnings.
Comparison with similar companies: EPS is generally judged against competitors in the same industry.
EPS and the P/E ratio
To see how much you are paying for every dollar of earning, you can try using this P/E calculator:
Gotrade is the trading name of Gotrade Securities Inc., which is registered with and supervised by the Labuan Financial Services Authority (LFSA). This content is for educational purposes only and does not constitute financial advice. Always do your own research (DYOR) before investing.
Sindhu Partomo is a copywriter and content writer with 8+ years of experience in agencies, B2B, and SaaS. He has been writing about business and finance since 2023, and holds a bachelor degree from University of Indonesia.
Hendrie Saputra holds a Master of Business Administration (MBA) with a concentration in Business Risk & Finance, along with professional experience in finance, marketing, and project management. He is experienced in analyzing market data and developing research-driven business strategies.