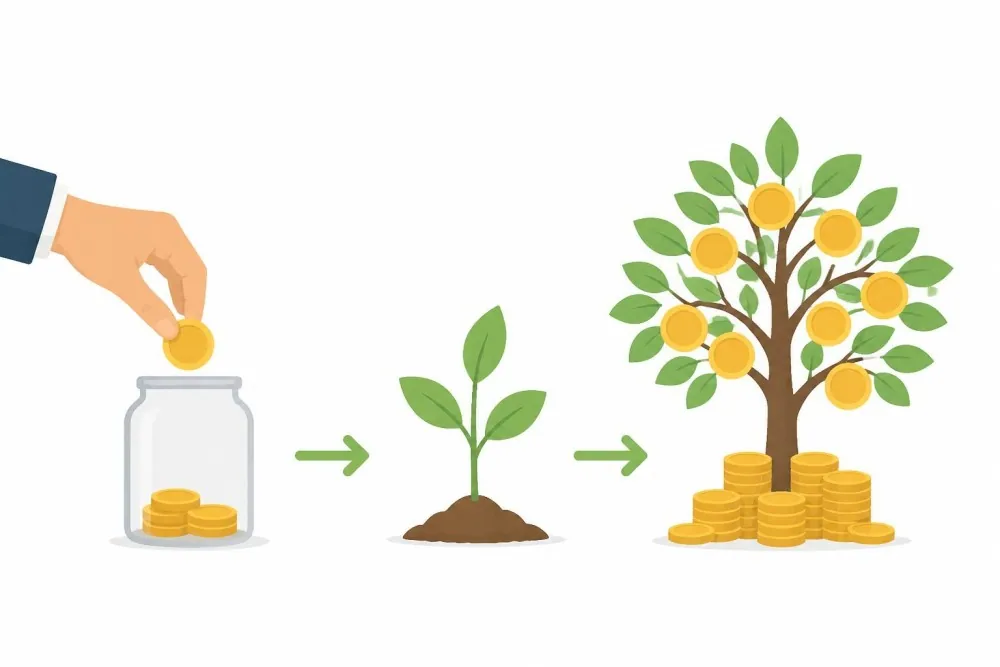
Return on Investment (ROI) expresses the gain or loss on an investment as a percentage of its cost, making it easy to compare investments of different sizes.
ROI differs from related measures such as total return, CAGR, ROE, ROA and ROIC.
This article explains the standard ROI formula, shows how fees and dividends change the result, and walks through examples.
ROI shows how much you gained or lost on an investment, as a percentage of what you paid. It’s easy to calculate, but easy to get wrong. This guide covers the formula, common mistakes, and what ROI can’t tell you.
ROI Meaning: What Return on Investment Tells You (and What It Doesn't)
ROI stands for Return on Investment, is the percentage value you gain or lose from the amount you paid for. For example, if you put $1000 in a business and you end up with $1100, your ROI is 10%. Conversely, if you end up with $900, your ROI is -10%.
People use ROI as an indicator on how good an investment is. Because it is stated in percentage, you can compare data from different investments, regardless of their sizes.
Be aware that ROI describes past, or hypothetical results. ROI itself may say nothing about the risk you took, and it does not predict future returns. Two investments with the same ROI can have very different ups and downs along the way, and every investment carries its risk.
The ROI Formula
The standard formula is:
ROI = (Current Value − Total Cost) / Total Cost × 100
Note: (Current Value - Total Cost) is also called "Net Gain".
Your ROI calculation is only accurate if you put the right numbers into the equation:
Total cost: this counts purchase price, commissions, platform or transaction fees, and any currency conversion costs (for example, if you have to convert your local currency into USD to buy US stocks).
Current value: this is what the investment is worth now, meaning your sale price (if you sold it) or current market value if you still hold it, plus any dividends or other cash you received while holding it.
A common mistake when calculating ROI is not counting in fees and dividends. Leaving out fees makes ROI look better, while leaving out dividends makes it look worse. Make sure you count both to get the right result.
Example: Single Stock Purchase
Note: All figures here are hypothetical and do not describe any real company's performance.
Scenario: Let' say, you buy 50 shares of a fictional company at $40 each, paying a $15 commission. Later you sell at $46 per share, paying another $15 commission. During the time you held those shares, you also received $30 in dividends.
Pay attention on how the fees pulled the result down by about 1.6 percentage points, and the dividends added about 1.5 back. Always be aware of hidden costs.
Example: Multiple Purchases
Sometimes we buy the same stock repeatedly, such as investing a fixed amount of money every month, for example. In this case, the purchase price can be different every time. To calculate the correct ROI on the whole investment, we must add up the cost of every lot, add up the shares, and compare the total value to the total cost.
Suppose you invest $300 in the same fictional stock on three occasions, and the current price is $55:
Lot
Amount invested
Price paid
Shares bought
Value today
ROI on lot
1
$300
$50
6.00
$330.00
10.00%
2
$300
$40
7.50
$412.50
37.50%
3
$300
$60
5.00
$275.00
-8.33%
Total
$900
18.50
$1,017.50
13.06%
These are the steps:
Total cost basis: $300 + $300 + $300 = $900.
Total shares: 6.00 + 7.50 + 5.00 = 18.50.
Average cost per share: $900 / 18.50 = $48.65.
Current value: 18.50 × $55 = $1,017.50.
Position ROI: ($1,017.50 - $900) / $900 = 13.06%.
Note: for simplicity, this example exclude fees. Also, notice that the average cost per share ($48.65) is lower than the simple average of the three prices ($50). This is because a fixed amount of money can buy more shares when the price is low, so cheaper lots affect the average more.
ROI Calculator
You can try calculating ROI using this calculator:
ROI calculator
Annualized ROI: Why Time Matters
Simple ROI ignores how long you held the investment. A 60% gain is a very different result after three years than after eight. To compare investments held for different periods, convert ROI to an annual rate:
Annualized ROI = (1 + ROI)^(1/years) - 1
People often make mistake of dividing the investment return by the number of years. This is not the accurate way to calculate annualized ROI, as you can see the difference here:
Investment A
Investment B
Total ROI
60%
60%
Holding period
3 years
8 years
Annualized ROI (Correct)
16.96%
6.05%
ROI divided by years (Wrong)
20.0%
7.5%
Another mistake people often make, is when annualizing a period shorter than a year, and assuming the number will automatically happen. A 5% gain in two months works out to roughly 34% annualized, but there is no guarantee it will turn out that way.
Real ROI: Adjusting for Inflation
Since purchasing power changes with inflation, you can also factor it in ROI calculation. The formula would be: Real ROI = (1 + Nominal ROI) / (1 + Inflation) - 1
Now, let's say you invest $10,000, and five years later it is worth $14,000. This makes a nominal ROI of 40%. However, you find that over those five years, prices rise by 15% (in total). Your calculation becomes:
Calculation
Real ROI
1.40 / 1.15 - 1
21.74%
When adjusting ROI for inflation, make sure that the inflation number matches your currency and time period.
How Fees and Costs Change Your ROI
There are two kinds of costs: recurring costs, and one time costs. Both will impact ROI, so let's try calculating them. Say, you invest $10,000 for 10 years in a fund whose investments earn 7% a year before costs. Here is the illustration if you are hit by different annual fees:
Annual fee
Net annual return
Value after 10 years
Total ROI
0.00%
7.00%
$19,672
96.7%
0.10%
6.90%
$19,488
94.9%
1.00%
6.00%
$17,908
79.1%
Meanwhile, one time (or one-off) costs will hit harder the smaller your transaction is. A $10 commission on a $500 transaction, for example, is 2%, while on a $10000 transaction, it's only 0.1%.
ROI vs Total Return, CAGR, ROE, ROA and ROIC
These are all different indicators, and you should pay attention to when to use them.
Measure
Subject
Formula
User
Use Case
ROI
Gain or loss relative to cost
(Current value - Total cost) / Total cost
Individual investors
You want a quick result on one holding, over any period
Total return
Price change plus all income
(End value + Income - Start value) / Start value
Investors, fund providers
Comparing funds or stocks on a like-for-like basis
Judging how efficiently a company uses owners' capital
ROA
Profit on everything a company owns
Net income / Total assets
Equity analysts
Comparing companies of similar business models, regardless of how they are financed
ROIC
Operating profit earned on capital
After-tax operating profit / Invested capital
Equity analysts
Judging whether a business earns more than its cost of capital
What Is a Good ROI?
There is no such thing as a universal "good" ROI number. However, you may want to take several things into account when looking at ROI:
Time horizon: 10% in one year and 10% in ten years are very different outcomes. Compare annualized figures as a consideration.
Risk taken: a gain earned with large swings in value is not always equal to the same amount of gain earned steadily. Consider the risk in volatility.
Inflation: a positive nominal ROI can still be a loss in purchasing power.
The alternative: pay attention to how much you can gain somewhere else.
Limitations of ROI and Common Mistakes
Mistake
Why it matters
How to avoid it
Ignoring time
Simple ROI does not say how long the gain took
Annualize ROI
Ignoring risk and volatility
Same ROI can have different swings and loss risk
Look at how much the value fluctuated
Counting costs inconsistently
Leaving out fees, currency costs or dividends
Decide your cost and value definitions
Mixing unrealized and realized gains
A paper gain can still disappear
Label results as realized or unrealized
Survivorship bias
Looking only at funds or stocks that still exist
Include closed, merged or delisted investments when comparing
Cherry-picked periods
Choosing a peak or trough to make ROI look better/worse
Use consistent dates, check more than one period
Ignoring taxes
Taxes on gains and dividends reduce what you keep
Consider after-tax ROI
Averaging lot returns
The average of several ROIs is not the ROI of the whole position
Calculate from total cost and total value
Conclusion
ROI indicates how much you gain or lose on the money you spent in an investment. A good-looking ROI says nothing about the risk taken. Judge it against a relevant benchmark over the same period.
This article is for general education only. It is not investment, tax or financial advice, and all figures used in examples are hypothetical.
Gotrade is the trading name of Gotrade Securities Inc., which is registered with and supervised by the Labuan Financial Services Authority (LFSA). This content is for educational purposes only and does not constitute financial advice. Always do your own research (DYOR) before investing.
Sindhu Partomo is a copywriter and content writer with 8+ years of experience in agencies, B2B, and SaaS. He has been writing about business and finance since 2023, and holds a bachelor degree from University of Indonesia.
Hendrie Saputra holds a Master of Business Administration (MBA) with a concentration in Business Risk & Finance, along with professional experience in finance, marketing, and project management. He is experienced in analyzing market data and developing research-driven business strategies.