
American Airlines (AAL) Stock
Key stats
- Market cap
- $8.73B
- Price / Earnings ratio
- -17.8x
- EPS (TTM)
- -$0.73
- Volume
- Loading
- 52-week high
- $18.79
- 52-week low
- $10.09
- EPS vs analyst estimate
- +37.0%Q3 FY25 · -$0.17 vs -$0.27
Source: third-party data provider, as of November 9, 2026
EPS estimate: analyst consensus
Compare with AAL
Recent news

JetBlue Soars 11%, United Rallies 6% as Oil Drops on Iran Peace Talk Hopes; American Airlines Gains 5%
JetBlue Soars 11%, United Rallies 6% as Oil Drops on Iran Peace Talk Hopes; American Airlines Gains 5%
AAL
As US airlines deploy AI pricing tools, startups help travelers cash in on fare drops
As US airlines deploy AI pricing tools, startups help travelers cash in on fare drops
AAL
As Iran war drags on, airlines pull back on fuel hedges and warn on fares
As Iran war drags on, airlines pull back on fuel hedges and warn on fares
AAL
American Airlines hikes annual fees on rewards cards for first time since 2018
American Airlines hikes annual fees on rewards cards for first time since 2018
AALNews tone: automated (AI) classification of the article's content, not a price prediction.
Technical indicators
- RSI 14
- 54.45
- MACD 12/26/9
- 0.05
- EMA 9 of MACD
- -0.09
- MACD histogram
- 0.14
- SMA 50
- $12.88
- Price above SMA 50
- EMA 50
- $13.06
- Price above EMA 50
- SMA 200
- $13.47
- Price below SMA 200
- EMA 200
- $13.50
- Price below EMA 200
Calculated by Gotrade from daily closing prices, as of November 6, 2026. Technical data, not a recommendation.
Analyst ratings
Analyst consensus: Hold
Based on 11 analyst ratings
Third-party analyst opinion, not a recommendation from Gotrade.
Financials
Performance
Debt & Balance Sheet
Revenue to Profit
2025Earnings
The market is expecting earnings per share of $0.24 for this quarter. The company has not yet shared when it is announcing earnings.
Source: third-party data provider
Latest news
JetBlue Soars 11%, United Rallies 6% as Oil Drops on Iran Peace Talk Hopes; American Airlines Gains 5%
JetBlue Soars 11%, United Rallies 6% as Oil Drops on Iran Peace Talk Hopes; American Airlines Gains 5%
AALAs US airlines deploy AI pricing tools, startups help travelers cash in on fare drops
As US airlines deploy AI pricing tools, startups help travelers cash in on fare drops
AALAs Iran war drags on, airlines pull back on fuel hedges and warn on fares
As Iran war drags on, airlines pull back on fuel hedges and warn on fares
AALAmerican Airlines hikes annual fees on rewards cards for first time since 2018
American Airlines hikes annual fees on rewards cards for first time since 2018
AAL
JetBlue Jumps 11% as Higher Fares Recapture Fuel Costs; Delta and American Airlines Inch Higher
JetBlue Jumps 11% as Higher Fares Recapture Fuel Costs; Delta and American Airlines Inch Higher
AAL
American Airlines and Citi Enhance the Citi / AAdvantage Platinum Select World Elite Mastercard and the Citi AAdvantage Business World Elite Mastercard With More Ways to Earn and New Travel Benefits
American Airlines and Citi Enhance the Citi / AAdvantage Platinum Select World Elite Mastercard and the Citi AAdvantage Business World Elite Mastercard With More Ways to Earn and New Travel Benefits
AAL
American Airlines: 3 Key Takeaways for Long-Term Investors
American Airlines: 3 Key Takeaways for Long-Term Investors
AAL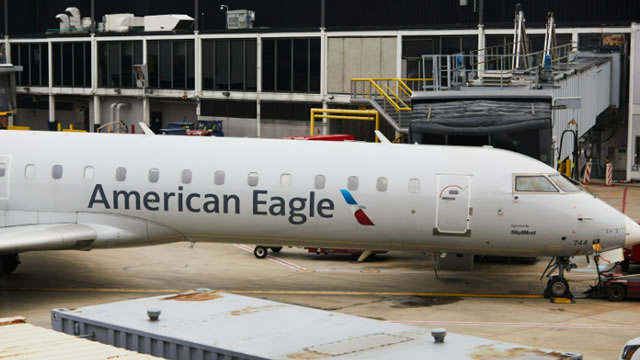
American Airlines says airfares could stay elevated even if fuel prices drop
American Airlines says airfares could stay elevated even if fuel prices drop
AAL
American Airlines Sinks 4% as Oil Climb Reverses Post-Earnings Rebound; Delta and United Airlines Slide 3%
American Airlines Sinks 4% as Oil Climb Reverses Post-Earnings Rebound; Delta and United Airlines Slide 3%
AAL
US airlines favor higher fares over fuller planes as fuel costs squeeze profits
US airlines favor higher fares over fuller planes as fuel costs squeeze profits
AALNews tone: automated (AI) classification of the article's content, not a price prediction.
About American Airlines
American Airlines Group Inc., a Delaware corporation, is a holding company and its principal, wholly-owned subsidiaries are American Airlines, Inc., Envoy Aviation Group Inc., PSA Airlines, Inc. and Piedmont Airlines, Inc. The company provides scheduled air transportation services for passengers and cargo through its hubs in Charlotte, Chicago, Dallas/Fort Worth, Los Angeles, Miami, New York, Philadelphia, Phoenix, and Washington, D.C., as well as through partner gateways in London, Madrid, Seattle/Tacoma, Sydney, and Tokyo.
Key Executives
| Name | Title | Year Born |
|---|---|---|
| Mr. Robert D. Isom Jr. | CEO, President & Director | 1964 |
| Mr. Devon E. May | Executive VP & CFO | 1975 |
| Mr. David G. Seymour | Executive VP & COO | 1965 |
| Mr. Anthony J. Richmond J.D. | Executive VP of Corporate Affairs & Chief Legal Officer | — |
| Mr. Stephen L. Johnson J.D. | Chief Strategy Officer & Vice Chair | 1956 |
| Mr. Ganesh Jayaram | Executive VP and Chief Digital & Information Officer | — |
| Mr. Neil A. Russell II | Vice President of Investor Relations | 1971 |
| Mr. Ronald J. Defeo | EVP of Communications and Marketing & Chief Communications Officer | — |
| Ms. Mecole Brown | Chief People Officer | — |
| Mr. Bruce Wark | Senior VP & Deputy General Counsel | — |
Fundamentals
Valuation
Profitability
Trading
Dividend
Source: third-party data provider, as of November 9, 2026
Technical indicators
- RSI 14
- 54.45
- MACD 12/26/9
- 0.05
- EMA 9 of MACD
- -0.09
- MACD histogram
- 0.14
- SMA 50
- $12.88
- Price above SMA 50
- EMA 50
- $13.06
- Price above EMA 50
- SMA 200
- $13.47
- Price below SMA 200
- EMA 200
- $13.50
- Price below EMA 200
Calculated by Gotrade from daily closing prices, as of November 6, 2026. Technical data, not a recommendation.
Analyst views
11 analyst ratings
Third-party analyst opinion, not a recommendation from Gotrade.
- Low
- $11.00
- Average
- $15.09
- High
- $22.00
Seasonality
Monthly price change (%)| Jan | Feb | Mar | Apr | May | Jun | Jul | Aug | Sep | Oct | Nov | Dec | |
|---|---|---|---|---|---|---|---|---|---|---|---|---|
| 2021 | -18.0 | +10.3 | ||||||||||
| 2022 | -12.2 | +2.5 | +12.0 | +2.9 | -3.7 | -26.7 | +4.4 | -9.0 | -6.9 | +19.0 | +2.3 | -9.0 |
| 2023 | +26.7 | -4.3 | -8.0 | -5.4 | +6.4 | +22.0 | -7.5 | -9.2 | -12.7 | -12.5 | +11.6 | +5.5 |
| 2024 | +5.9 | +9.3 | -2.0 | -12.3 | -15.3 | -1.7 | -3.6 | +4.7 | +6.0 | +22.9 | +7.2 | +19.3 |
| 2025 | -0.5 | -14.1 | -23.9 | -3.4 | +13.8 | -1.4 | -0.3 | +21.2 | -16.1 | +16.5 | +5.3 | +9.8 |
| 2026 | -14.1 | -4.5 | -14.2 | +5.2 | +23.6 | +26.0 | -15.9 | -16.3 | +3.2 | -4.0 | +0.8 |










