
Algoma Steel Group Inc. Common Shares (ASTL) Stock
NASDAQ · ASTL
Key stats
- Market cap
- $608.61M
- Price / Earnings ratio
- -1.1x
- EPS (TTM)
- -$4.83
- Volume
- Loading
- 52-week high
- $5.90
- 52-week low
- $3.16
Source: third-party data provider, as of November 13, 2026
Compare with ASTL
Recent news

MarketBeat
Algoma Steel Group Q3 Earnings Call Highlights
NeutralASTLOctober 29, 2026
MarketBeatNeutral
Algoma Steel Group Q3 Earnings Call Highlights
ASTL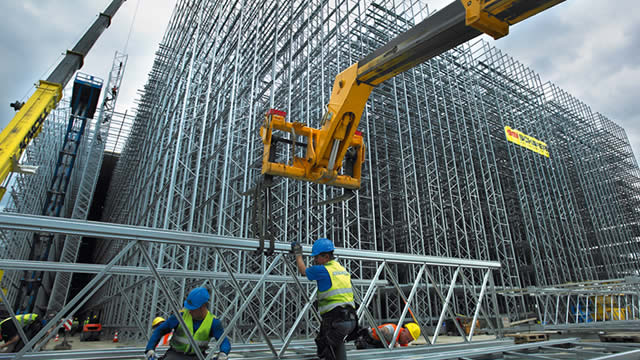
Zacks Investment Research
Algoma Steel Group Inc. (ASTL) Reports Q3 Loss, Beats Revenue Estimates
NeutralASTLOctober 29, 2026
Zacks Investment ResearchNeutral
Algoma Steel Group Inc. (ASTL) Reports Q3 Loss, Beats Revenue Estimates
ASTL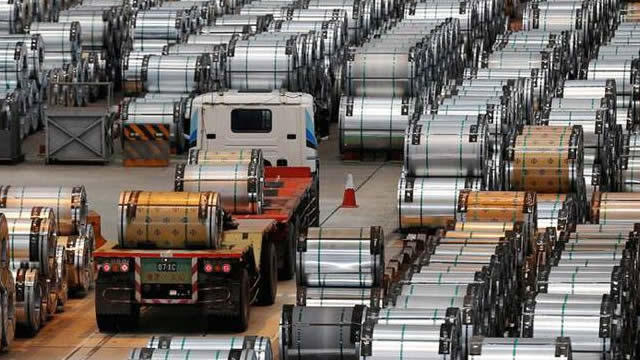
Zacks Investment Research
Earnings Preview: Algoma Steel Group Inc. (ASTL) Q3 Earnings Expected to Decline
NegativeASTLOctober 21, 2026
Zacks Investment ResearchNegative
Earnings Preview: Algoma Steel Group Inc. (ASTL) Q3 Earnings Expected to Decline
ASTL
Reuters
Canadian steelmakers offset some US tariff pain with domestic demand
NeutralASTLOctober 16, 2026
ReutersNeutral
Canadian steelmakers offset some US tariff pain with domestic demand
ASTLNews tone: automated (AI) classification of the article's content, not a price prediction.
Technical indicators
- RSI 14
- 70.34
- MACD 12/26/9
- 0.35
- EMA 9 of MACD
- 0.25
- MACD histogram
- 0.10
- SMA 50
- $4.54
- Price above SMA 50
- EMA 50
- $4.68
- Price above EMA 50
- SMA 200
- $4.48
- Price above SMA 200
- EMA 200
- $4.45
- Price above EMA 200
Calculated by Gotrade from daily closing prices, as of November 11, 2026. Technical data, not a recommendation.
Analyst ratings
No analyst data available
Financials
Performance
Revenue
Net income
Net margin %
2022
2023
2024
2025
2026
4B2B1B0
Debt & Balance Sheet
Total assets
Total liabilities
2022
2023
2024
2025
2026
4B2B1B0
Revenue to Profit
2026$1.3B
Revenue$0.0
Cost of revenue$-682.4M
Gross profit$0.0
Operating expenses$-1.1B
Net incomeEarnings
No data available
Source: third-party data provider
Latest news
MarketBeat
Algoma Steel Group Q3 Earnings Call Highlights
NeutralASTLOctober 29, 2026
MarketBeatNeutral
Algoma Steel Group Q3 Earnings Call Highlights
ASTLZacks Investment Research
Algoma Steel Group Inc. (ASTL) Reports Q3 Loss, Beats Revenue Estimates
NeutralASTLOctober 29, 2026
Zacks Investment ResearchNeutral
Algoma Steel Group Inc. (ASTL) Reports Q3 Loss, Beats Revenue Estimates
ASTLZacks Investment Research
Earnings Preview: Algoma Steel Group Inc. (ASTL) Q3 Earnings Expected to Decline
NegativeASTLOctober 21, 2026
Zacks Investment ResearchNegative
Earnings Preview: Algoma Steel Group Inc. (ASTL) Q3 Earnings Expected to Decline
ASTLReuters
Canadian steelmakers offset some US tariff pain with domestic demand
NeutralASTLOctober 16, 2026
ReutersNeutral
Canadian steelmakers offset some US tariff pain with domestic demand
ASTL
MarketBeat
Algoma Steel Group Q2 Earnings Call Highlights
ASTLJuly 30, 2026
MarketBeat
Algoma Steel Group Q2 Earnings Call Highlights
ASTL
Zacks Investment Research
Algoma Steel Group Inc. (ASTL) Reports Q2 Loss, Lags Revenue Estimates
ASTLJuly 30, 2026
Zacks Investment Research
Algoma Steel Group Inc. (ASTL) Reports Q2 Loss, Lags Revenue Estimates
ASTL
Zacks Investment Research
Algoma Steel Group Inc. (ASTL) May Report Negative Earnings: Know the Trend Ahead of Next Week's Release
ASTLJuly 22, 2026
Zacks Investment Research
Algoma Steel Group Inc. (ASTL) May Report Negative Earnings: Know the Trend Ahead of Next Week's Release
ASTL
MarketBeat
Algoma Steel Group Q1 Earnings Call Highlights
ASTLMay 13, 2026
MarketBeat
Algoma Steel Group Q1 Earnings Call Highlights
ASTL
Zacks Investment Research
Earnings Preview: Algoma Steel Group Inc. (ASTL) Q1 Earnings Expected to Decline
ASTLMay 5, 2026
Zacks Investment Research
Earnings Preview: Algoma Steel Group Inc. (ASTL) Q1 Earnings Expected to Decline
ASTL
Zacks Investment Research
Algoma Steel Group Inc. (ASTL) Reports Q4 Loss, Lags Revenue Estimates
ASTLMarch 11, 2026
Zacks Investment Research
Algoma Steel Group Inc. (ASTL) Reports Q4 Loss, Lags Revenue Estimates
ASTLNews tone: automated (AI) classification of the article's content, not a price prediction.
About Algoma Steel Group Inc. Common Shares
No description available.
SectorBasic Materials
IndustrySteel
Employees2,400
CEOMr. Rajat Marwah
IPO DateOct 20, 2021
HeadquartersSault Sainte Marie, ON
Key Executives
| Name | Title | Year Born |
|---|---|---|
| Mr. Rajat Marwah | CEO & Director | 1974 |
| Mr. Michael Moraca | Chief Financial Officer | — |
| Mr. John Ralph Naccarato | VP of Strategy & Chief Legal Officer | 1967 |
| Mr. Michael Panzeri | Senior Vice President of Production | — |
| Ms. Danielle Baker | Chief Human Resource Officer | — |
| Mr. Chris Ford | Chief Commercial Officer | — |
| Ms. Laura Devoni | Vice President of Human Resources and Corporate Affairs | — |
Fundamentals
Valuation
Price-to-sales ratio0.38
Price-to-book value4.32
Profitability
Return on Equity-225.00%
Return on Assets-37.00%
Return on Sales-62.00%
Gross margin (latest quarter)-44.01%
EBITDA$-553.30M
Trading
Average volume1,378,457
Dividend
Ex dividend date13 May 2025
Last payment date30 May 2025
Source: third-party data provider, as of November 13, 2026
Technical indicators
- RSI 14
- 70.34
- MACD 12/26/9
- 0.35
- EMA 9 of MACD
- 0.25
- MACD histogram
- 0.10
- SMA 50
- $4.54
- Price above SMA 50
- EMA 50
- $4.68
- Price above EMA 50
- SMA 200
- $4.48
- Price above SMA 200
- EMA 200
- $4.45
- Price above EMA 200
Calculated by Gotrade from daily closing prices, as of November 11, 2026. Technical data, not a recommendation.
Analyst views
No analyst data available
Seasonality
Monthly price change (%)| Jan | Feb | Mar | Apr | May | Jun | Jul | Aug | Sep | Oct | Nov | Dec | |
|---|---|---|---|---|---|---|---|---|---|---|---|---|
| 2021 | -7.9 | +3.1 | ||||||||||
| 2022 | -14.9 | -2.4 | +20.3 | -18.8 | +2.7 | -6.9 | +0.0 | -2.1 | -26.2 | +3.5 | -3.8 | -4.1 |
| 2023 | +34.3 | -4.1 | -1.5 | -8.0 | -4.5 | +0.3 | +7.2 | +1.7 | -10.3 | +5.3 | +17.6 | +16.2 |
| 2024 | -12.5 | -3.8 | +7.6 | -11.4 | +0.1 | -8.9 | +27.7 | +11.8 | +1.2 | +2.7 | +1.7 | -7.4 |
| 2025 | -15.9 | -10.0 | -20.3 | -5.9 | -1.3 | +39.5 | -22.6 | -5.3 | -26.3 | +22.6 | +1.4 | +5.4 |
| 2026 | +6.6 | +8.5 | -12.5 | +13.6 | +16.6 | -30.2 | +0.5 | +7.4 | +1.0 | +16.1 | +16.6 |
Corporate actions
Upcoming
No upcoming corporate actions for ASTL
Past
DividendQ2/25
Ex-dividend date13 May 2025
Payable date30 May 2025
Amount per share$0.05
DividendQ1/25
Ex-dividend date21 Mar 2025
Payable date10 Apr 2025
Amount per share$0.05
DividendQ4/24
Ex-dividend date27 Nov 2024
Payable date27 Dec 2024
Amount per share$0.05
DividendQ3/24
Ex-dividend date23 Aug 2024
Payable date27 Sep 2024
Amount per share$0.05
DividendQ3/24
Ex-dividend date2 Jul 2024
Payable date19 Jul 2024
Amount per share$0.05
DividendQ1/24
Ex-dividend date28 Feb 2024
Payable date28 Mar 2024
Amount per share$0.05
DividendQ4/23
Ex-dividend date29 Nov 2023
Payable date29 Dec 2023
Amount per share$0.05
DividendQ3/23
Ex-dividend date24 Aug 2023
Payable date29 Sep 2023
Amount per share$0.05
DividendQ3/23
Ex-dividend date3 Jul 2023
Payable date24 Jul 2023
Amount per share$0.05
DividendQ1/23
Ex-dividend date27 Feb 2023
Payable date31 Mar 2023
Amount per share$0.05
DividendQ4/22
Ex-dividend date29 Nov 2022
Payable date30 Dec 2022
Amount per share$0.05
DividendQ3/22
Ex-dividend date30 Aug 2022
Payable date30 Sep 2022
Amount per share$0.05
DividendQ2/22
Ex-dividend date24 Jun 2022
Payable date15 Jul 2022
Amount per share$0.05
DividendQ1/22
Ex-dividend date25 Feb 2022
Payable date31 Mar 2022
Amount per share$0.05
Compare stocks
Market cap
$608.61M
-
-
-
Price / Earnings ratio
-1.10
-
-
-
Price / Sales ratio
0.38
-
-
-
Dividend yield
0.00%
-
-
-
Average volume
1,378,457
-
-
-
Earnings per share
$-4.83
-
-
-










