BXP, Inc. (BXP) Stock
Key stats
- Market cap
- $10.13B
- Price / Earnings ratio
- 19.0x
- EPS (TTM)
- $3.36
- Volume
- Loading
- 52-week high
- $74.94
- 52-week low
- $49.72
- Dividend yield
- 4.41%
- Dividend amount (latest)
- $0.70
- EPS vs analyst estimate
- +89.1%Q3 FY25 · $1.74 vs $0.92
Source: third-party data provider, as of November 13, 2026
EPS estimate: analyst consensus
Compare with BXP
Recent news
Here's Why Boston Properties (BXP) is a Strong Value Stock
Here's Why Boston Properties (BXP) is a Strong Value Stock
BXP
Why Boston Properties (BXP) is a Top Momentum Stock for the Long-Term
Why Boston Properties (BXP) is a Top Momentum Stock for the Long-Term
BXP
BXP Q3 Earnings Call Highlights
BXP Q3 Earnings Call Highlights
BXP
BXP Q3 FFO & Revenues Beat Estimates on Occupancy Gains, 26' View Up
BXP Q3 FFO & Revenues Beat Estimates on Occupancy Gains, 26' View Up
BXPNews tone: automated (AI) classification of the article's content, not a price prediction.
Technical indicators
- RSI 14
- 52.50
- MACD 12/26/9
- 0.82
- EMA 9 of MACD
- 0.49
- MACD histogram
- 0.32
- SMA 50
- $62.43
- Price above SMA 50
- EMA 50
- $63.05
- Price above EMA 50
- SMA 200
- $61.99
- Price above SMA 200
- EMA 200
- $63.15
- Price above EMA 200
Calculated by Gotrade from daily closing prices, as of November 11, 2026. Technical data, not a recommendation.
Analyst ratings
Analyst consensus: Hold
Based on 7 analyst ratings
Third-party analyst opinion, not a recommendation from Gotrade.
Financials
Performance
Debt & Balance Sheet
Revenue to Profit
2025Earnings
The market is expecting earnings per share of $1.83 for this quarter. The company has not yet shared when it is announcing earnings.
Source: third-party data provider
Latest news
Here's Why Boston Properties (BXP) is a Strong Value Stock
Here's Why Boston Properties (BXP) is a Strong Value Stock
BXPWhy Boston Properties (BXP) is a Top Momentum Stock for the Long-Term
Why Boston Properties (BXP) is a Top Momentum Stock for the Long-Term
BXPBXP Q3 Earnings Call Highlights
BXP Q3 Earnings Call Highlights
BXPBXP Q3 FFO & Revenues Beat Estimates on Occupancy Gains, 26' View Up
BXP Q3 FFO & Revenues Beat Estimates on Occupancy Gains, 26' View Up
BXP
Here's What Key Metrics Tell Us About Boston Properties (BXP) Q3 Earnings
Here's What Key Metrics Tell Us About Boston Properties (BXP) Q3 Earnings
BXP
Boston Properties (BXP) Surpasses Q3 FFO and Revenue Estimates
Boston Properties (BXP) Surpasses Q3 FFO and Revenue Estimates
BXP
BXP Announces Third Quarter 2026 Results
BXP Announces Third Quarter 2026 Results
BXP
BXP to Post Q3 Earnings: Is the Stock a Portfolio Must-Have?
BXP to Post Q3 Earnings: Is the Stock a Portfolio Must-Have?
BXP
BXP Completes Initial Sale of Partial Interest in 343 Madison Avenue Development
BXP Completes Initial Sale of Partial Interest in 343 Madison Avenue Development
BXP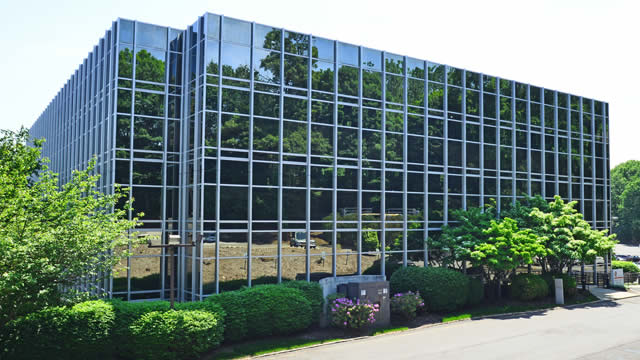
BXP's 343 Madison Ave. tower is going up
BXP's 343 Madison Ave. tower is going up
BXPNews tone: automated (AI) classification of the article's content, not a price prediction.
About BXP, Inc.
Boston Properties, a self-administered and self-managed real estate investment trust (REIT), is one of the largest owners, managers and developers of Class A office properties in the United States, with a significant presence in five markets: Boston, Los Angeles, New York, San Francisco and Washington, DC.
Key Executives
| Name | Title | Year Born |
|---|---|---|
| Mr. Owen David Thomas | CEO & Chairman of the Board | 1962 |
| Mr. Michael E. LaBelle | Executive VP, Treasurer & CFO | 1964 |
| Mr. Douglas T. Linde | President & Director | 1964 |
| Mr. Bryan J. Koop | Executive Vice President of Boston Region | 1959 |
| Ms. Hilary J. Spann | Executive Vice President of New York Region | 1976 |
| Mr. Mortimer B. Zuckerman | Co-Founder & Chairman Emeritus | 1938 |
| Mr. Michael R. Walsh | Senior VP & Chief Accounting Officer | 1967 |
| Mr. Colin Joynt | Senior VP & Chief Information Officer | — |
| Ms. Helen Han | Vice President of Investor Relations | — |
| Mr. Eric G. Kevorkian | Senior VP, Chief Legal Officer & Secretary | 1972 |
Fundamentals
Valuation
Profitability
Trading
Dividend
Source: third-party data provider, as of November 13, 2026
Technical indicators
- RSI 14
- 52.50
- MACD 12/26/9
- 0.82
- EMA 9 of MACD
- 0.49
- MACD histogram
- 0.32
- SMA 50
- $62.43
- Price above SMA 50
- EMA 50
- $63.05
- Price above EMA 50
- SMA 200
- $61.99
- Price above SMA 200
- EMA 200
- $63.15
- Price above EMA 200
Calculated by Gotrade from daily closing prices, as of November 11, 2026. Technical data, not a recommendation.
Analyst views
7 analyst ratings
Third-party analyst opinion, not a recommendation from Gotrade.
- Low
- $65.00
- Average
- $73.00
- High
- $87.00
Seasonality
Monthly price change (%)| Jan | Feb | Mar | Apr | May | Jun | Jul | Aug | Sep | Oct | Nov | Dec | |
|---|---|---|---|---|---|---|---|---|---|---|---|---|
| 2021 | -10.6 | +9.4 | ||||||||||
| 2022 | -6.6 | +5.9 | +6.6 | -9.7 | -5.2 | -17.7 | +0.6 | -11.3 | -6.2 | -4.0 | -0.2 | -5.7 |
| 2023 | +11.9 | -12.0 | -16.5 | -0.5 | -7.8 | +19.9 | +14.0 | +3.2 | -10.8 | -6.8 | +6.4 | +10.9 |
| 2024 | -7.8 | -0.9 | -1.4 | -2.2 | +2.4 | +2.5 | +17.5 | +7.0 | +8.3 | +1.1 | +3.6 | -8.1 |
| 2025 | -0.8 | -1.0 | -1.2 | -4.8 | +4.7 | -0.2 | -3.9 | +12.2 | +2.7 | -6.7 | +2.5 | -6.2 |
| 2026 | -4.6 | -8.7 | -7.7 | +14.6 | +1.1 | +12.1 | +3.5 | -3.4 | -8.9 | +4.2 | -0.0 |
Corporate actions
Upcoming
No upcoming corporate actions for BXP