Douglas Emmett Inc (DEI) Stock
Key stats
- Market cap
- $1.68B
- Price / Earnings ratio
- -80.5x
- EPS (TTM)
- -$0.13
- Volume
- Loading
- 52-week high
- $12.97
- 52-week low
- $9.04
- Dividend yield
- 7.59%
- Dividend amount (latest)
- $0.19
Source: third-party data provider, as of November 13, 2026
Compare with DEI
Recent news
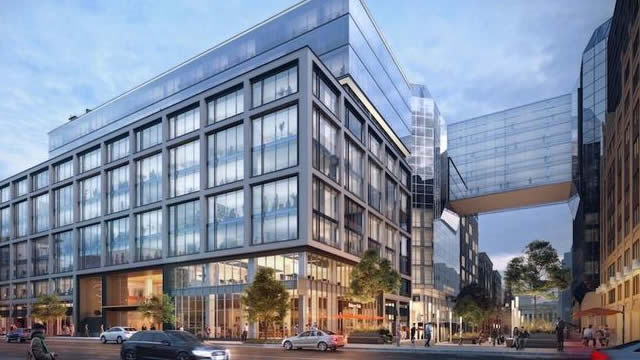
Douglas Emmett (DEI) Tops Q3 FFO and Revenue Estimates
Douglas Emmett (DEI) Tops Q3 FFO and Revenue Estimates
DEI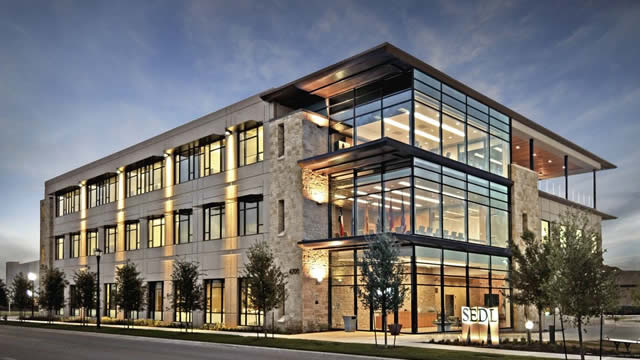
Compared to Estimates, Douglas Emmett (DEI) Q3 Earnings: A Look at Key Metrics
Compared to Estimates, Douglas Emmett (DEI) Q3 Earnings: A Look at Key Metrics
DEI
Douglas Emmett Releases Third Quarter 2026 Earnings Results
Douglas Emmett Releases Third Quarter 2026 Earnings Results
DEI
Douglas Emmett Announces Dates for Its 2026 Third Quarter Earnings Results and Live Conference Call
Douglas Emmett Announces Dates for Its 2026 Third Quarter Earnings Results and Live Conference Call
DEINews tone: automated (AI) classification of the article's content, not a price prediction.
Technical indicators
- RSI 14
- 48.30
- MACD 12/26/9
- 0.03
- EMA 9 of MACD
- 0.01
- MACD histogram
- 0.02
- SMA 50
- $10.12
- Price below SMA 50
- EMA 50
- $10.29
- Price below EMA 50
- SMA 200
- $10.85
- Price below SMA 200
- EMA 200
- $10.75
- Price below EMA 200
Calculated by Gotrade from daily closing prices, as of November 11, 2026. Technical data, not a recommendation.
Analyst ratings
Analyst consensus: Hold
Based on 3 analyst ratings
Third-party analyst opinion, not a recommendation from Gotrade.
Financials
Performance
Debt & Balance Sheet
Revenue to Profit
2025Earnings
The market is expecting earnings per share of $0.36 for this quarter. The company has not yet shared when it is announcing earnings.
Source: third-party data provider
Latest news
Douglas Emmett (DEI) Tops Q3 FFO and Revenue Estimates
Douglas Emmett (DEI) Tops Q3 FFO and Revenue Estimates
DEICompared to Estimates, Douglas Emmett (DEI) Q3 Earnings: A Look at Key Metrics
Compared to Estimates, Douglas Emmett (DEI) Q3 Earnings: A Look at Key Metrics
DEIDouglas Emmett Releases Third Quarter 2026 Earnings Results
Douglas Emmett Releases Third Quarter 2026 Earnings Results
DEIDouglas Emmett Announces Dates for Its 2026 Third Quarter Earnings Results and Live Conference Call
Douglas Emmett Announces Dates for Its 2026 Third Quarter Earnings Results and Live Conference Call
DEI
Douglas Emmett Declares Quarterly Cash Dividend
Douglas Emmett Declares Quarterly Cash Dividend
DEI
Douglas Emmett Q2 Earnings Call Highlights
Douglas Emmett Q2 Earnings Call Highlights
DEI
Douglas Emmett (DEI) Q2 Earnings: How Key Metrics Compare to Wall Street Estimates
Douglas Emmett (DEI) Q2 Earnings: How Key Metrics Compare to Wall Street Estimates
DEI
Douglas Emmett (DEI) Q2 FFO and Revenues Top Estimates
Douglas Emmett (DEI) Q2 FFO and Revenues Top Estimates
DEI
Douglas Emmett Releases Second Quarter 2026 Earnings Results
Douglas Emmett Releases Second Quarter 2026 Earnings Results
DEI
Are Investors Undervaluing Douglas Emmett (DEI) Right Now?
Are Investors Undervaluing Douglas Emmett (DEI) Right Now?
DEINews tone: automated (AI) classification of the article's content, not a price prediction.
About Douglas Emmett Inc
Douglas Emmett Inc is an integrated, self-administered, and self-managed REIT. It is an owner and operator of office and multifamily properties located in coastal submarkets in Los Angeles and Honolulu. The group focuses on owning, acquiring, developing, and managing a substantial market share of office properties and multifamily communities in neighborhoods with supply constraints, high-end executive housing, and key lifestyle amenities. Its properties are located in the Beverly Hills, Brentwood, Burbank, Century City, Olympic Corridor, Santa Monica, Sherman Oaks/Encino, Warner Center/Woodland Hills and Westwood submarkets of Los Angeles County, California, and in Honolulu, Hawaii. It has two business segments, the office segment and the multifamily segment.
Key Executives
| Name | Title | Year Born |
|---|---|---|
| Mr. Jordan L. Kaplan | CEO & Chairman | 1961 |
| Mr. Kenneth M. Panzer | President, COO & Director | 1960 |
| Mr. Peter D. Seymour | Chief Financial Officer | 1968 |
| Mr. Kevin Andrew Crummy | Chief Investment Officer | 1966 |
| Ms. Michele L. Aronson | Executive VP, General Counsel & Secretary | 1970 |
| Mr. Stuart McElhinney | Vice President of Investor Relations | — |
| Mr. Michael J. Means | Senior Vice President of Commercial Leasing | 1961 |
| Mr. Allan B. Golad | Senior Vice President of Property Management | 1955 |
Fundamentals
Valuation
Profitability
Trading
Dividend
Source: third-party data provider, as of November 13, 2026
Technical indicators
- RSI 14
- 48.30
- MACD 12/26/9
- 0.03
- EMA 9 of MACD
- 0.01
- MACD histogram
- 0.02
- SMA 50
- $10.12
- Price below SMA 50
- EMA 50
- $10.29
- Price below EMA 50
- SMA 200
- $10.85
- Price below SMA 200
- EMA 200
- $10.75
- Price below EMA 200
Calculated by Gotrade from daily closing prices, as of November 11, 2026. Technical data, not a recommendation.
Analyst views
3 analyst ratings
Third-party analyst opinion, not a recommendation from Gotrade.
- Low
- $11.00
- Average
- $13.00
- High
- $16.00
Seasonality
Monthly price change (%)| Jan | Feb | Mar | Apr | May | Jun | Jul | Aug | Sep | Oct | Nov | Dec | |
|---|---|---|---|---|---|---|---|---|---|---|---|---|
| 2021 | -11.2 | +5.7 | ||||||||||
| 2022 | -10.2 | -0.5 | +5.6 | -12.7 | -3.2 | -18.5 | +3.3 | -16.7 | -7.9 | -2.8 | -0.6 | -7.9 |
| 2023 | +10.1 | -17.0 | -12.9 | +5.1 | -8.2 | +11.2 | +12.0 | -5.4 | -9.1 | -9.2 | +6.6 | +7.0 |
| 2024 | -8.7 | +0.0 | +3.4 | +2.9 | +3.8 | -3.8 | +21.6 | +1.8 | +11.3 | +1.4 | +10.5 | -3.6 |
| 2025 | -2.1 | -4.2 | -4.8 | -14.7 | +0.1 | +5.8 | -1.7 | +8.7 | -3.8 | -18.0 | -5.9 | -9.4 |
| 2026 | -4.6 | -4.4 | -3.1 | +17.1 | +6.4 | +1.9 | -2.7 | -2.9 | -16.0 | +4.3 | -1.2 |
Corporate actions
Upcoming
No upcoming corporate actions for DEI