SL Green Realty (SLG) Stock
Key stats
- Market cap
- $3.50B
- Price / Earnings ratio
- -18.4x
- EPS (TTM)
- -$2.72
- Volume
- Loading
- 52-week high
- $60.09
- 52-week low
- $34.77
- Dividend yield
- 3.92%
- Dividend amount (latest)
- $0.62
Source: third-party data provider, as of November 5, 2026
Compare with SLG
Recent news
What SL Green Realty (SLG) Said on Its Q3 Earnings Call
What SL Green Realty (SLG) Said on Its Q3 Earnings Call
SLG
SL Green (SLG) Matches Q3 FFO Estimates
SL Green (SLG) Matches Q3 FFO Estimates
SLG
SL Green (SLG) Q3 Earnings: How Key Metrics Compare to Wall Street Estimates
SL Green (SLG) Q3 Earnings: How Key Metrics Compare to Wall Street Estimates
SLG
Is it Wise to Retain SL Green Stock in Your Portfolio Now?
Is it Wise to Retain SL Green Stock in Your Portfolio Now?
SLGNews tone: automated (AI) classification of the article's content, not a price prediction.
Technical indicators
- RSI 14
- 63.35
- MACD 12/26/9
- 0.29
- EMA 9 of MACD
- -0.33
- MACD histogram
- 0.62
- SMA 50
- $50.88
- Price above SMA 50
- EMA 50
- $50.37
- Price above EMA 50
- SMA 200
- $46.83
- Price above SMA 200
- EMA 200
- $47.69
- Price above EMA 200
Calculated by Gotrade from daily closing prices, as of November 4, 2026. Technical data, not a recommendation.
Analyst ratings
Analyst consensus: Hold
Based on 7 analyst ratings
Third-party analyst opinion, not a recommendation from Gotrade.
Financials
Performance
Debt & Balance Sheet
Revenue to Profit
2025Earnings
No data available
Source: third-party data provider
Latest news
What SL Green Realty (SLG) Said on Its Q3 Earnings Call
What SL Green Realty (SLG) Said on Its Q3 Earnings Call
SLGSL Green (SLG) Matches Q3 FFO Estimates
SL Green (SLG) Matches Q3 FFO Estimates
SLGSL Green (SLG) Q3 Earnings: How Key Metrics Compare to Wall Street Estimates
SL Green (SLG) Q3 Earnings: How Key Metrics Compare to Wall Street Estimates
SLGIs it Wise to Retain SL Green Stock in Your Portfolio Now?
Is it Wise to Retain SL Green Stock in Your Portfolio Now?
SLG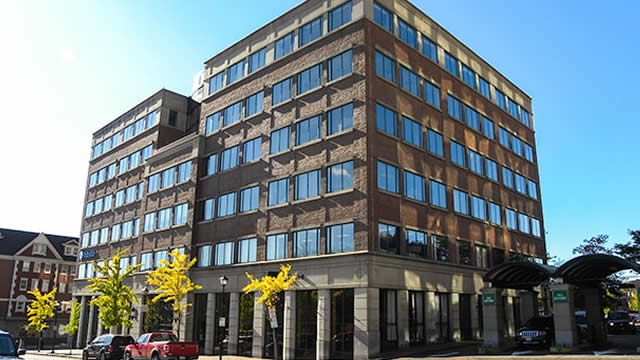
SL Green putting finishing touches on $225M facelift at 245 Park Ave.
SL Green putting finishing touches on $225M facelift at 245 Park Ave.
SLG
Data Centers Got the AI Hype—But Office REITs May Get the Rent Hikes
Data Centers Got the AI Hype—But Office REITs May Get the Rent Hikes
SLG
New Strong Buy Stocks for September 23rd
New Strong Buy Stocks for September 23rd
SLG
Best Income Stocks to Buy for September 23rd
Best Income Stocks to Buy for September 23rd
SLG
3 Reasons to Add SL Green Realty Stock to Your Portfolio Now
3 Reasons to Add SL Green Realty Stock to Your Portfolio Now
SLG
SL Green's Leasing Momentum Strengthens Across Manhattan Offices
SL Green's Leasing Momentum Strengthens Across Manhattan Offices
SLGNews tone: automated (AI) classification of the article's content, not a price prediction.
About SL Green Realty
SL Green Realty is one of the largest Manhattan property owners and landlords, with interest in around 32 million square feet of wholly owned and joint-venture office space. The company has additional property exposure through its limited portfolio of well-located retail space. It operates as a real estate investment trust.
Key Executives
| Name | Title | Year Born |
|---|---|---|
| Mr. Marc Holliday | Chairman & CEO | 1966 |
| Mr. Matthew J. DiLiberto | Chief Financial Officer | 1974 |
| Mr. Edward V. Piccinich | Chief Operating Officer | 1963 |
| Mr. Andrew S. Levine J.D. | Chief Legal Officer, Executive VP, General Counsel & Secretary | 1959 |
| Mr. Harrison Sitomer | President & Chief Investment Officer | 1990 |
| Ms. Maggie Hui | Chief Accounting Officer | 1964 |
| Mr. Steven M. Durels | Executive VP and Director of Leasing & Real Property | 1959 |
| Mr. Neil H. Kessner | Executive VP & General Counsel of Real Property | — |
| Mr. Richard Currenti | Senior VP & Director of Engineering | — |
| Mr. Robert Schiffer | Executive Vice President of Development | — |
Fundamentals
Valuation
Profitability
Trading
Dividend
Source: third-party data provider, as of November 5, 2026
Technical indicators
- RSI 14
- 63.35
- MACD 12/26/9
- 0.29
- EMA 9 of MACD
- -0.33
- MACD histogram
- 0.62
- SMA 50
- $50.88
- Price above SMA 50
- EMA 50
- $50.37
- Price above EMA 50
- SMA 200
- $46.83
- Price above SMA 200
- EMA 200
- $47.69
- Price above EMA 200
Calculated by Gotrade from daily closing prices, as of November 4, 2026. Technical data, not a recommendation.
Analyst views
7 analyst ratings
Third-party analyst opinion, not a recommendation from Gotrade.
- Low
- $48.00
- Average
- $56.86
- High
- $62.00
Seasonality
Monthly price change (%)| Jan | Feb | Mar | Apr | May | Jun | Jul | Aug | Sep | Oct | Nov | Dec | |
|---|---|---|---|---|---|---|---|---|---|---|---|---|
| 2021 | -10.2 | +9.3 | ||||||||||
| 2022 | -6.1 | +7.3 | +3.9 | -14.8 | -10.0 | -23.2 | +4.7 | -11.9 | -7.8 | -1.4 | +6.5 | -18.6 |
| 2023 | +20.6 | -17.1 | -30.8 | -0.5 | -1.8 | +33.4 | +23.4 | +7.0 | -4.6 | -18.7 | +24.7 | +12.4 |
| 2024 | -2.1 | +5.1 | +13.7 | -5.9 | +6.6 | +6.8 | +21.2 | +0.4 | +8.2 | +8.7 | +5.1 | -10.3 |
| 2025 | -1.4 | -2.0 | -8.1 | -9.3 | +6.1 | +7.9 | -8.3 | +2.0 | +5.9 | -15.2 | -6.5 | -2.1 |
| 2026 | -4.6 | -14.5 | -1.7 | +15.6 | +6.0 | +15.7 | +1.4 | +3.3 | -10.4 | +3.3 | +6.6 |
Corporate actions
Upcoming
No upcoming corporate actions for SLG