Liberty Energy Inc. (LBRT) Stock
Key stats
- Market cap
- $2.11B
- Price / Earnings ratio
- 50.6x
- EPS (TTM)
- $0.24
- Volume
- Loading
- 52-week high
- $34.48
- 52-week low
- $11.24
- Dividend yield
- 2.79%
- Dividend amount (latest)
- $0.09
Source: third-party data provider, as of November 13, 2026
Compare with LBRT
Recent news
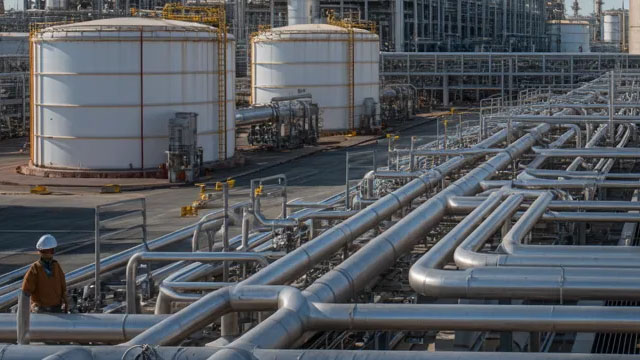
Liberty Energy: 3 Key Takeaways for Long-Term Investors
Liberty Energy: 3 Key Takeaways for Long-Term Investors
LBRT
LBRT Stock Down 8.2% YTD: Should Investors Hold or Buy the Dip?
LBRT Stock Down 8.2% YTD: Should Investors Hold or Buy the Dip?
LBRT
LBRT Q3 Earnings Miss Estimates on Higher Costs, Revenues Rise
LBRT Q3 Earnings Miss Estimates on Higher Costs, Revenues Rise
LBRT
What Liberty Energy (LBRT) Said on Its Q3 Earnings Call
What Liberty Energy (LBRT) Said on Its Q3 Earnings Call
LBRTNews tone: automated (AI) classification of the article's content, not a price prediction.
Technical indicators
- RSI 14
- 35.53
- MACD 12/26/9
- -1.56
- EMA 9 of MACD
- -1.29
- MACD histogram
- -0.27
- SMA 50
- $17.71
- Price below SMA 50
- EMA 50
- $17.16
- Price below EMA 50
- SMA 200
- $24.42
- Price below SMA 200
- EMA 200
- $21.77
- Price below EMA 200
Calculated by Gotrade from daily closing prices, as of November 11, 2026. Technical data, not a recommendation.
Analyst ratings
Analyst consensus: Buy
Based on 7 analyst ratings
Third-party analyst opinion, not a recommendation from Gotrade.
Financials
Performance
Debt & Balance Sheet
Revenue to Profit
2025Earnings
No data available
Source: third-party data provider
Latest news
Liberty Energy: 3 Key Takeaways for Long-Term Investors
Liberty Energy: 3 Key Takeaways for Long-Term Investors
LBRTLBRT Stock Down 8.2% YTD: Should Investors Hold or Buy the Dip?
LBRT Stock Down 8.2% YTD: Should Investors Hold or Buy the Dip?
LBRTLBRT Q3 Earnings Miss Estimates on Higher Costs, Revenues Rise
LBRT Q3 Earnings Miss Estimates on Higher Costs, Revenues Rise
LBRTWhat Liberty Energy (LBRT) Said on Its Q3 Earnings Call
What Liberty Energy (LBRT) Said on Its Q3 Earnings Call
LBRT
Liberty Energy (LBRT) Misses Q3 Earnings Estimates
Liberty Energy (LBRT) Misses Q3 Earnings Estimates
LBRT
Liberty Energy Inc. Announces Third Quarter 2026 Financial and Operational Results
Liberty Energy Inc. Announces Third Quarter 2026 Financial and Operational Results
LBRT
What Liberty Energy's Dividend Raise Says About Management's Confidence
What Liberty Energy's Dividend Raise Says About Management's Confidence
LBRT
Liberty Energy Inc. Announces 11% Increase in Quarterly Cash Dividend
Liberty Energy Inc. Announces 11% Increase in Quarterly Cash Dividend
LBRT
Liberty Energy Gears Up to Report Q3 Earnings: Here's How It Will Fare
Liberty Energy Gears Up to Report Q3 Earnings: Here's How It Will Fare
LBRT
Liberty Energy (LBRT) Reports Next Week: Wall Street Expects Earnings Growth
Liberty Energy (LBRT) Reports Next Week: Wall Street Expects Earnings Growth
LBRTNews tone: automated (AI) classification of the article's content, not a price prediction.
About Liberty Energy Inc.
No description available.
Key Executives
| Name | Title | Year Born |
|---|---|---|
| Mr. Ron Gusek | President, CEO & Director | 1972 |
| Mr. Michael Stock | CFO & Treasurer | 1962 |
| Mr. Ryan T. Gosney | Chief Accounting Officer & Vice President of Finance | 1973 |
| Mr. R. Sean Elliott | Chief Legal Officer & Corporate Secretary | 1975 |
| Mr. Jim Brady | Founder & Senior VP of Operations | — |
| Ms. Anjali Ramnath Voria | Director of Investor Relations | — |
| Ms. Tracee Quinnell | Vice President of Human Resources | — |
Fundamentals
Valuation
Profitability
Trading
Dividend
Source: third-party data provider, as of November 13, 2026
Technical indicators
- RSI 14
- 35.53
- MACD 12/26/9
- -1.56
- EMA 9 of MACD
- -1.29
- MACD histogram
- -0.27
- SMA 50
- $17.71
- Price below SMA 50
- EMA 50
- $17.16
- Price below EMA 50
- SMA 200
- $24.42
- Price below SMA 200
- EMA 200
- $21.77
- Price below EMA 200
Calculated by Gotrade from daily closing prices, as of November 11, 2026. Technical data, not a recommendation.
Analyst views
7 analyst ratings
Third-party analyst opinion, not a recommendation from Gotrade.
- Low
- $19.00
- Average
- $24.86
- High
- $28.00
Seasonality
Monthly price change (%)| Jan | Feb | Mar | Apr | May | Jun | Jul | Aug | Sep | Oct | Nov | Dec | |
|---|---|---|---|---|---|---|---|---|---|---|---|---|
| 2021 | -13.3 | +10.9 | ||||||||||
| 2022 | +13.6 | -2.0 | +25.6 | +4.5 | +0.4 | -24.2 | +12.0 | +8.1 | -9.4 | +24.0 | -4.2 | -0.7 |
| 2023 | +8.4 | -1.6 | -19.0 | -5.9 | -10.0 | +6.5 | +20.1 | -3.4 | +12.2 | +10.4 | -0.6 | -8.5 |
| 2024 | +14.5 | +4.7 | -5.1 | +4.9 | +17.4 | -11.1 | +19.1 | -9.8 | -3.9 | -14.4 | +10.3 | +7.2 |
| 2025 | -11.6 | -4.2 | -0.9 | -27.4 | -2.5 | -3.0 | +3.4 | -3.1 | +11.8 | +44.1 | -3.2 | +1.4 |
| 2026 | +30.6 | +7.7 | +1.1 | +21.0 | -10.5 | -10.8 | -23.0 | +3.8 | -9.4 | -8.6 | -12.1 |