Namib Minerals Ordinary Shares (NAMM) Stock
NASDAQ · NAMM
Key stats
- Market cap
- $43.69M
- Price / Earnings ratio
- 0.4x
- EPS (TTM)
- $2.11
- Volume
- Loading
- 52-week high
- $7.42
- 52-week low
- $0.60
Source: third-party data provider, as of November 13, 2026
Compare with NAMM
Recent news

MarketBeat
What Namib Minerals (NAMM) Said on Its Q2 Earnings Call
PositiveNAMMOctober 1, 2026
MarketBeatPositive
What Namib Minerals (NAMM) Said on Its Q2 Earnings Call
NAMM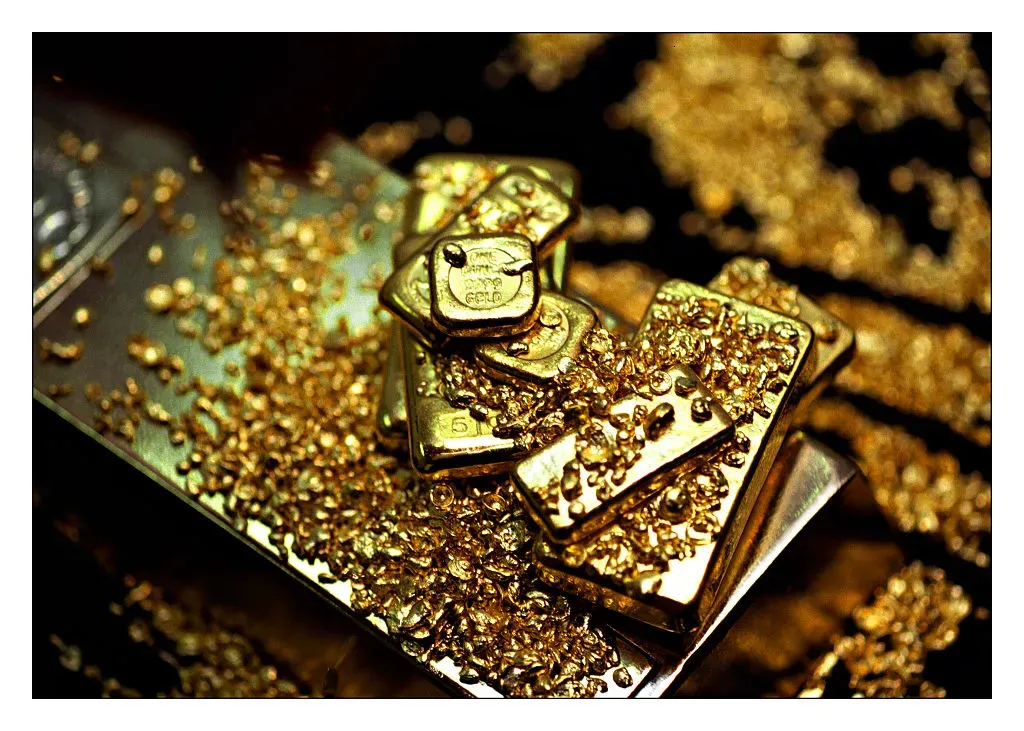
Stocktwits
Why Did Shares Of This Africa-Based Micro-Cap Company Soar Over 43% Today?
NAMMJanuary 28, 2026
Stocktwits
Why Did Shares Of This Africa-Based Micro-Cap Company Soar Over 43% Today?
NAMMNews tone: automated (AI) classification of the article's content, not a price prediction.
Technical indicators
- RSI 14
- 35.74
- MACD 12/26/9
- -0.08
- EMA 9 of MACD
- -0.10
- MACD histogram
- 0.01
- SMA 50
- $1.08
- Price below SMA 50
- EMA 50
- $1.04
- Price below EMA 50
- SMA 200
- $1.86
- Price below SMA 200
- EMA 200
- $1.59
- Price below EMA 200
Calculated by Gotrade from daily closing prices, as of November 11, 2026. Technical data, not a recommendation.
Analyst ratings
No analyst data available
Financials
Performance
Revenue
Net income
Net margin %
2021
2022
2023
2024
2025
121M80M40M0
Debt & Balance Sheet
Total assets
Total liabilities
2021
2022
2023
2024
2025
415M274M137M0
Revenue to Profit
2025$82.6M
Revenue$0.0
Cost of revenue$34.2M
Gross profit$0.0
Operating expenses$101.2M
Net incomeEarnings
No data available
Source: third-party data provider
Latest news
MarketBeat
What Namib Minerals (NAMM) Said on Its Q2 Earnings Call
PositiveNAMMOctober 1, 2026
MarketBeatPositive
What Namib Minerals (NAMM) Said on Its Q2 Earnings Call
NAMMStocktwits
Why Did Shares Of This Africa-Based Micro-Cap Company Soar Over 43% Today?
NAMMJanuary 28, 2026
Stocktwits
Why Did Shares Of This Africa-Based Micro-Cap Company Soar Over 43% Today?
NAMMNews tone: automated (AI) classification of the article's content, not a price prediction.
About Namib Minerals Ordinary Shares
Namib Minerals is a gold producer, developer and explorer with operations focused in Zimbabwe.
SectorBasic Materials
IndustryGold
Employees1,500
CEOMr. Tulani Sikwila
IPO DateJun 6, 2025
HeadquartersGrand Cayman, Cayman Islands
Key Executives
| Name | Title | Year Born |
|---|---|---|
| Mr. Tulani Sikwila | Chairman of the Board & CEO | 1980 |
| Mr. Siphesihle Mchunu | CFO & Director | 1989 |
| Ms. Lamiaa Maniar Elaker | Vice President of Communications | — |
| Ms. Hannerietta R. Choga | Vice President People & Culture | — |
| Mr. Tavepi Dafana | Country Managing Director | — |
| Mr. Mike Cross | Head of Technology Services | — |
| Mr. Renaud Houlle | Vice President of Finance | — |
Fundamentals
Valuation
Price-to-sales ratio0.53
Price-to-book value-1.11
Profitability
Return on Equity-112.00%
Return on Assets161.00%
Return on Sales124.00%
EBITDA$117.73M
Trading
Average volume489,837
Source: third-party data provider, as of November 13, 2026
Technical indicators
- RSI 14
- 35.74
- MACD 12/26/9
- -0.08
- EMA 9 of MACD
- -0.10
- MACD histogram
- 0.01
- SMA 50
- $1.08
- Price below SMA 50
- EMA 50
- $1.04
- Price below EMA 50
- SMA 200
- $1.86
- Price below SMA 200
- EMA 200
- $1.59
- Price below EMA 200
Calculated by Gotrade from daily closing prices, as of November 11, 2026. Technical data, not a recommendation.
Analyst views
No analyst data available
Seasonality
Monthly price change (%)| Jan | Feb | Mar | Apr | May | Jun | Jul | Aug | Sep | Oct | Nov | Dec | |
|---|---|---|---|---|---|---|---|---|---|---|---|---|
| 2026 | -34.9 | -2.6 | -40.5 | -14.4 | -24.0 | -9.6 | -28.5 | +3.0 | -29.9 | -40.8 | +4.0 |
Compare stocks
Market cap
$43.69M
-
-
-
Price / Earnings ratio
0.40
-
-
-
Price / Sales ratio
0.53
-
-
-
Dividend yield
0.00%
-
-
-
Average volume
489,837
-
-
-
Earnings per share
$2.11
-
-
-