
NioCorp Developments Ltd. Common Stock (NB) Stock
Key stats
- Market cap
- $427.70M
- Price / Earnings ratio
- -507.7x
- EPS (TTM)
- $0.02
- Volume
- Loading
- 52-week high
- $8.18
- 52-week low
- $2.59
Source: third-party data provider, as of November 13, 2026
Compare with NB
Recent news

NioCorp Advances Elk Creek Mine as EXIM Deal Highlights U.S. Critical Minerals Push
NioCorp Advances Elk Creek Mine as EXIM Deal Highlights U.S. Critical Minerals Push
NB
China Still Dominates Rare Earths—These 3 U.S. Companies Could Benefit
China Still Dominates Rare Earths—These 3 U.S. Companies Could Benefit
NB
NB Private Equity Partners H1 Earnings Call Highlights
NB Private Equity Partners H1 Earnings Call Highlights
NB
MP vs. NB: Which Critical Minerals Stock is the Better Buy?
MP vs. NB: Which Critical Minerals Stock is the Better Buy?
NBNews tone: automated (AI) classification of the article's content, not a price prediction.
Technical indicators
- RSI 14
- 43.00
- MACD 12/26/9
- -0.13
- EMA 9 of MACD
- -0.13
- MACD histogram
- 0.00
- SMA 50
- $3.41
- Price below SMA 50
- EMA 50
- $3.45
- Price below EMA 50
- SMA 200
- $4.74
- Price below SMA 200
- EMA 200
- $4.61
- Price below EMA 200
Calculated by Gotrade from daily closing prices, as of November 11, 2026. Technical data, not a recommendation.
Analyst ratings
Analyst consensus: Hold
Based on 1 analyst rating
Third-party analyst opinion, not a recommendation from Gotrade.
Financials
Performance
Debt & Balance Sheet
Revenue to Profit
2026Earnings
No data available
Source: third-party data provider
Latest news
NioCorp Advances Elk Creek Mine as EXIM Deal Highlights U.S. Critical Minerals Push
NioCorp Advances Elk Creek Mine as EXIM Deal Highlights U.S. Critical Minerals Push
NBChina Still Dominates Rare Earths—These 3 U.S. Companies Could Benefit
China Still Dominates Rare Earths—These 3 U.S. Companies Could Benefit
NBNB Private Equity Partners H1 Earnings Call Highlights
NB Private Equity Partners H1 Earnings Call Highlights
NBMP vs. NB: Which Critical Minerals Stock is the Better Buy?
MP vs. NB: Which Critical Minerals Stock is the Better Buy?
NB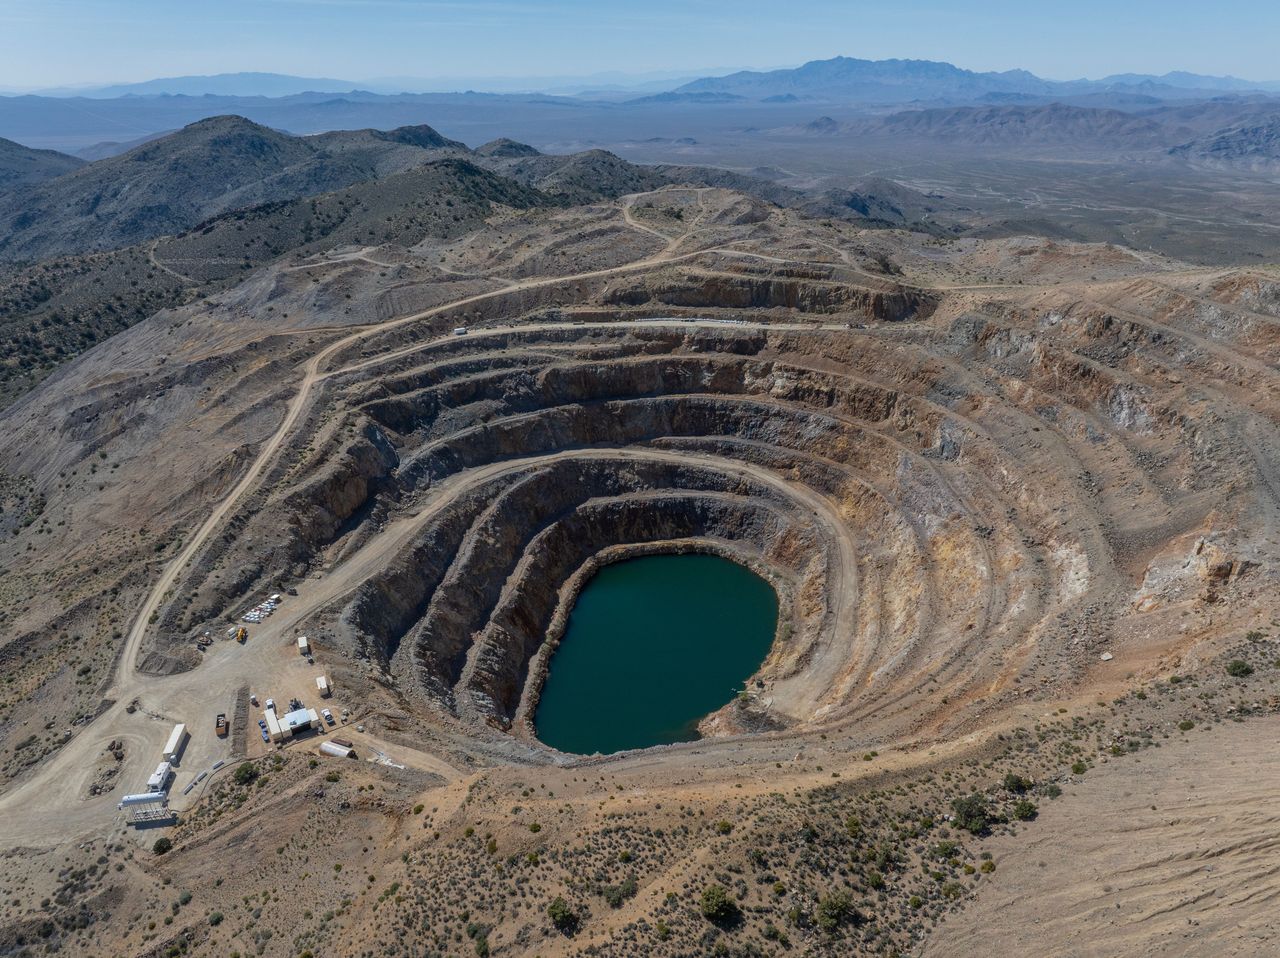
CRML Jumps, USAR And MP Advance As Rare-Earth Stocks Catch Government Tailwinds
CRML Jumps, USAR And MP Advance As Rare-Earth Stocks Catch Government Tailwinds
NB
NioCorp's Elk Creek Study Sees $4.1B NPV, 40-Year Critical Minerals Mine
NioCorp's Elk Creek Study Sees $4.1B NPV, 40-Year Critical Minerals Mine
NB
Rare Earth Stocks Soar on Friday: MP Materials Up 8%, USA Rare Earth Up 9%, NioCorp Up 3%. What's Behind the Jump?
Rare Earth Stocks Soar on Friday: MP Materials Up 8%, USA Rare Earth Up 9%, NioCorp Up 3%. What's Behind the Jump?
NB
Why NioCorp Stock Soared Today
Why NioCorp Stock Soared Today
NB
Why NioCorp Developments Stock Popped Today
Why NioCorp Developments Stock Popped Today
NB
Wall Street Analysts Think NioCorp Developments Ltd. (NB) Could Surge 100.7%: Read This Before Placing a Bet
Wall Street Analysts Think NioCorp Developments Ltd. (NB) Could Surge 100.7%: Read This Before Placing a Bet
NBNews tone: automated (AI) classification of the article's content, not a price prediction.
About NioCorp Developments Ltd. Common Stock
No description available.
Key Executives
| Name | Title | Year Born |
|---|---|---|
| Mr. Mark Allan Smith Esq., J.D., P.E. | Executive Chairman, President & CEO | 1959 |
| Mr. Neal S. Shah MBA | CFO & Corporate Secretary | 1974 |
| Mr. Scott Honan M.Sc. | Chief Operating Officer | 1971 |
| Mr. Jim T. Sims | Chief Communications Officer | 1961 |
| Mr. Ernest M. Cleave C.A., CPA, M.B.A. | Senior Vice President of Business Development | 1969 |
| Mr. Jeff Mason | Controller | — |
Fundamentals
Valuation
Profitability
Trading
Source: third-party data provider, as of November 13, 2026
Technical indicators
- RSI 14
- 43.00
- MACD 12/26/9
- -0.13
- EMA 9 of MACD
- -0.13
- MACD histogram
- 0.00
- SMA 50
- $3.41
- Price below SMA 50
- EMA 50
- $3.45
- Price below EMA 50
- SMA 200
- $4.74
- Price below SMA 200
- EMA 200
- $4.61
- Price below EMA 200
Calculated by Gotrade from daily closing prices, as of November 11, 2026. Technical data, not a recommendation.
Analyst views
1 analyst rating
Third-party analyst opinion, not a recommendation from Gotrade.
- Low
- $4.70
- Average
- $4.70
- High
- $4.70
Seasonality
Monthly price change (%)| Jan | Feb | Mar | Apr | May | Jun | Jul | Aug | Sep | Oct | Nov | Dec | |
|---|---|---|---|---|---|---|---|---|---|---|---|---|
| 2023 | -16.0 | -12.5 | -11.6 | -6.3 | -4.8 | -18.9 | +0.3 | +25.5 | -26.1 | -1.2 | ||
| 2024 | -1.3 | -13.6 | +9.7 | -19.8 | +14.6 | -26.1 | +4.9 | +9.4 | +26.0 | -9.0 | -16.4 | +16.5 |
| 2025 | +57.2 | -17.1 | -2.5 | +22.1 | -2.5 | -6.8 | +28.8 | +45.6 | +52.9 | +12.0 | -4.1 | -6.9 |
| 2026 | -0.8 | -14.0 | -20.4 | +31.5 | -4.6 | -21.4 | -11.6 | -6.1 | -10.0 | -2.6 | -6.4 |