OR Royalties Inc. (OR) Stock
Key stats
- Market cap
- $6.67B
- Price / Earnings ratio
- 24.1x
- EPS (TTM)
- $1.51
- Volume
- Loading
- 52-week high
- $48.06
- 52-week low
- $27.54
- Dividend yield
- 0.69%
- Dividend amount (latest)
- $0.07
- EPS vs analyst estimate
- +10.0%Q3 FY25 · $0.22 vs $0.20
Source: third-party data provider, as of November 13, 2026
EPS estimate: analyst consensus
Compare with OR
Recent news

Is OR Royalties (OR) a Solid Growth Stock? 3 Reasons to Think "Yes"
Is OR Royalties (OR) a Solid Growth Stock? 3 Reasons to Think "Yes"
OR
OR Royalties Q2 Earnings Call Highlights
OR Royalties Q2 Earnings Call Highlights
OR
OR Royalties Q1 Earnings Call Highlights
OR Royalties Q1 Earnings Call Highlights
OR
OR Royalties (OR) Forms 'Hammer Chart Pattern': Time for Bottom Fishing?
OR Royalties (OR) Forms 'Hammer Chart Pattern': Time for Bottom Fishing?
ORNews tone: automated (AI) classification of the article's content, not a price prediction.
Technical indicators
- RSI 14
- 53.87
- MACD 12/26/9
- 0.34
- EMA 9 of MACD
- -0.05
- MACD histogram
- 0.39
- SMA 50
- $35.08
- Price above SMA 50
- EMA 50
- $34.64
- Price above EMA 50
- SMA 200
- $36.31
- Price below SMA 200
- EMA 200
- $36.03
- Price below EMA 200
Calculated by Gotrade from daily closing prices, as of November 11, 2026. Technical data, not a recommendation.
Analyst ratings
Analyst consensus: Buy
Based on 1 analyst rating
Third-party analyst opinion, not a recommendation from Gotrade.
Financials
Performance
Debt & Balance Sheet
Revenue to Profit
2025Earnings
The market is expecting earnings per share of $0.25 for this quarter. The company has not yet shared when it is announcing earnings.
Source: third-party data provider
Latest news
Is OR Royalties (OR) a Solid Growth Stock? 3 Reasons to Think "Yes"
Is OR Royalties (OR) a Solid Growth Stock? 3 Reasons to Think "Yes"
OROR Royalties Q2 Earnings Call Highlights
OR Royalties Q2 Earnings Call Highlights
OROR Royalties Q1 Earnings Call Highlights
OR Royalties Q1 Earnings Call Highlights
OROR Royalties (OR) Forms 'Hammer Chart Pattern': Time for Bottom Fishing?
OR Royalties (OR) Forms 'Hammer Chart Pattern': Time for Bottom Fishing?
OR
Global Strategic Takes New Position in OR Royalties Stock, Valued at $8.0 Million, According to Recent SEC Filing
Global Strategic Takes New Position in OR Royalties Stock, Valued at $8.0 Million, According to Recent SEC Filing
OR
OR Royalties (OR) Is Up 1.50% in One Week: What You Should Know
OR Royalties (OR) Is Up 1.50% in One Week: What You Should Know
OR
All You Need to Know About OR Royalties (OR) Rating Upgrade to Strong Buy
All You Need to Know About OR Royalties (OR) Rating Upgrade to Strong Buy
OR
Up 119% in a Year, This Gold Royalty Stock Just Saw a $2.6 Million Trim Amid a Historic Run
Up 119% in a Year, This Gold Royalty Stock Just Saw a $2.6 Million Trim Amid a Historic Run
OR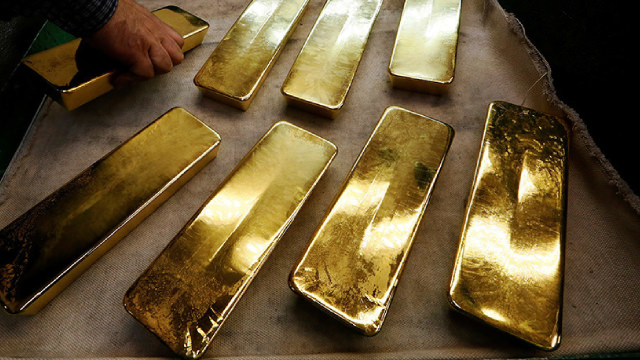
OR Royalties (OR) is an Incredible Growth Stock: 3 Reasons Why
OR Royalties (OR) is an Incredible Growth Stock: 3 Reasons Why
OR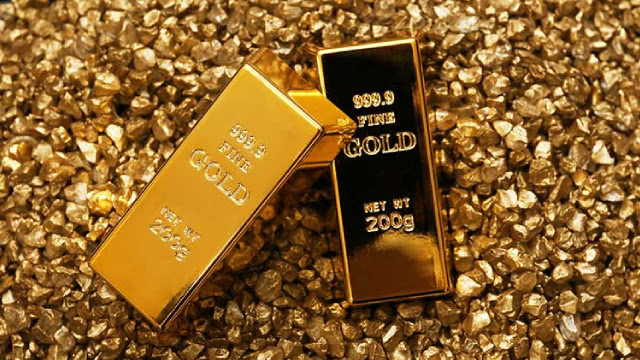
Wall Street Analysts Think OR Royalties (OR) Could Surge 25.04%: Read This Before Placing a Bet
Wall Street Analysts Think OR Royalties (OR) Could Surge 25.04%: Read This Before Placing a Bet
ORNews tone: automated (AI) classification of the article's content, not a price prediction.
About OR Royalties Inc.
Osisko Gold Royalties Ltd is an intermediate precious metal royalty company focused on the Americas that commenced activities in June 2014. Osisko holds a North American focused portfolio of over 150 royalties, streams and precious metal offtakes. Osisko’s portfolio is anchored by its cornerstone asset, a 5% net smelter return royalty on the Canadian Malartic mine, which is the largest gold mine in Canada.
Key Executives
| Name | Title | Year Born |
|---|---|---|
| Mr. Jason Mark Attew B.Sc., M.B.A. | CEO, President & Director | 1970 |
| Mr. Frederic Ruel C.A., CPA | CFO & VP of Finance | 1977 |
| Mr. Andre Le Bel B.Sc., B.Sc.A, L.L.B. | VP of Legal Affairs & Corporate Secretary | 1968 |
| Mr. Michael David-Saynor Spencer | President of OR Royalties International Ltd. | 1987 |
| Mr. Sean E. O. Roosen Eng. | Founder & Chair Emeritus | 1963 |
| Ms. Heather Taylor B.A. | Vice President of Sustainability & Communications | — |
| Mr. Iain W. Farmer B.Eng, C.F.A., M.B.A. | Vice President of Corporate Development | 1986 |
| Mr. Grant Moenting P.Eng. | Vice President of Capital Markets | — |
Fundamentals
Valuation
Profitability
Trading
Dividend
Source: third-party data provider, as of November 13, 2026
Technical indicators
- RSI 14
- 53.87
- MACD 12/26/9
- 0.34
- EMA 9 of MACD
- -0.05
- MACD histogram
- 0.39
- SMA 50
- $35.08
- Price above SMA 50
- EMA 50
- $34.64
- Price above EMA 50
- SMA 200
- $36.31
- Price below SMA 200
- EMA 200
- $36.03
- Price below EMA 200
Calculated by Gotrade from daily closing prices, as of November 11, 2026. Technical data, not a recommendation.
Analyst views
1 analyst rating
Third-party analyst opinion, not a recommendation from Gotrade.
- Low
- $47.00
- Average
- $47.00
- High
- $47.00
Seasonality
Monthly price change (%)| Jan | Feb | Mar | Apr | May | Jun | Jul | Aug | Sep | Oct | Nov | Dec | |
|---|---|---|---|---|---|---|---|---|---|---|---|---|
| 2021 | -10.5 | +4.8 | ||||||||||
| 2022 | -7.3 | +11.5 | +0.6 | -9.6 | -6.9 | -11.6 | +0.3 | -7.2 | +9.7 | +2.2 | +16.3 | -5.7 |
| 2023 | +9.2 | -3.0 | +16.9 | -0.2 | -3.6 | -5.4 | -5.8 | -7.8 | -10.7 | +6.6 | +19.6 | -3.4 |
| 2024 | +3.4 | -2.7 | +8.3 | -7.1 | +7.5 | -7.3 | +13.4 | +0.2 | +10.8 | +7.7 | -4.9 | -5.4 |
| 2025 | -0.6 | -1.9 | +17.3 | +14.7 | +9.0 | -5.0 | +8.3 | +15.1 | +23.3 | -20.4 | +9.6 | +2.6 |
| 2026 | +12.0 | +22.4 | -20.3 | -8.0 | +0.8 | -12.0 | -5.2 | +21.5 | -3.5 | -6.3 | +8.6 |
Corporate actions
Upcoming
No upcoming corporate actions for OR